01
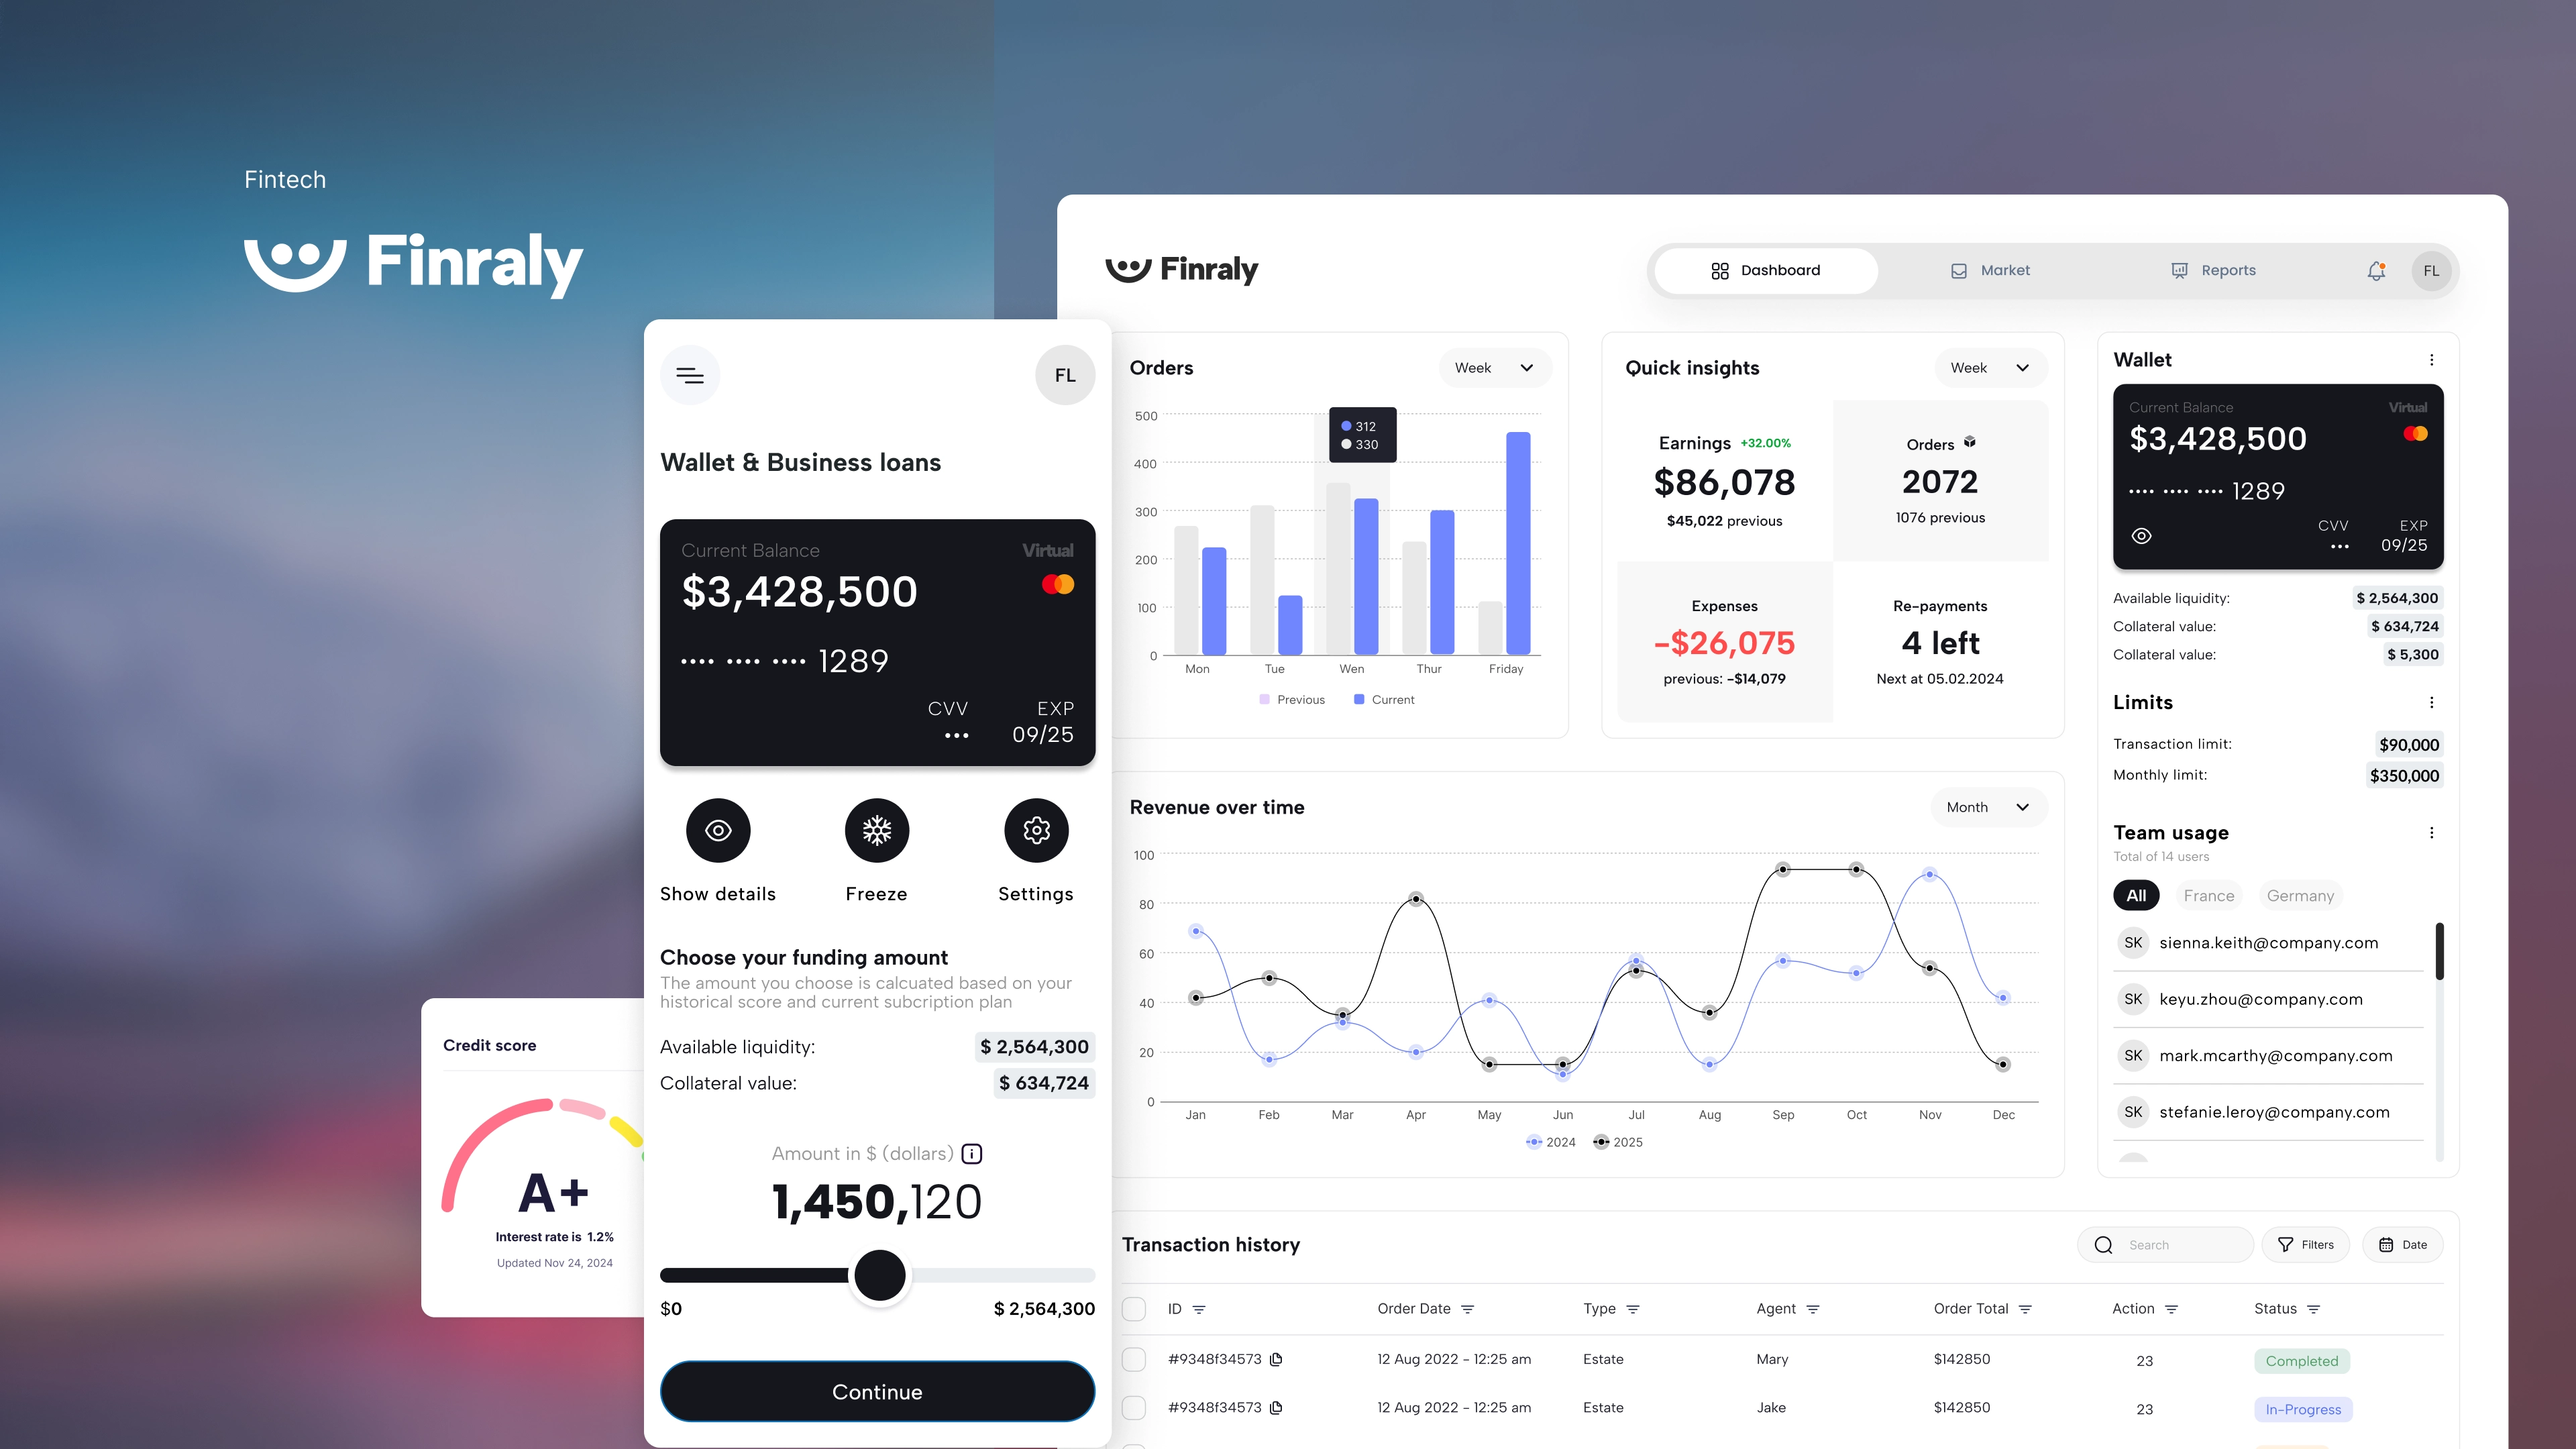
Finraly
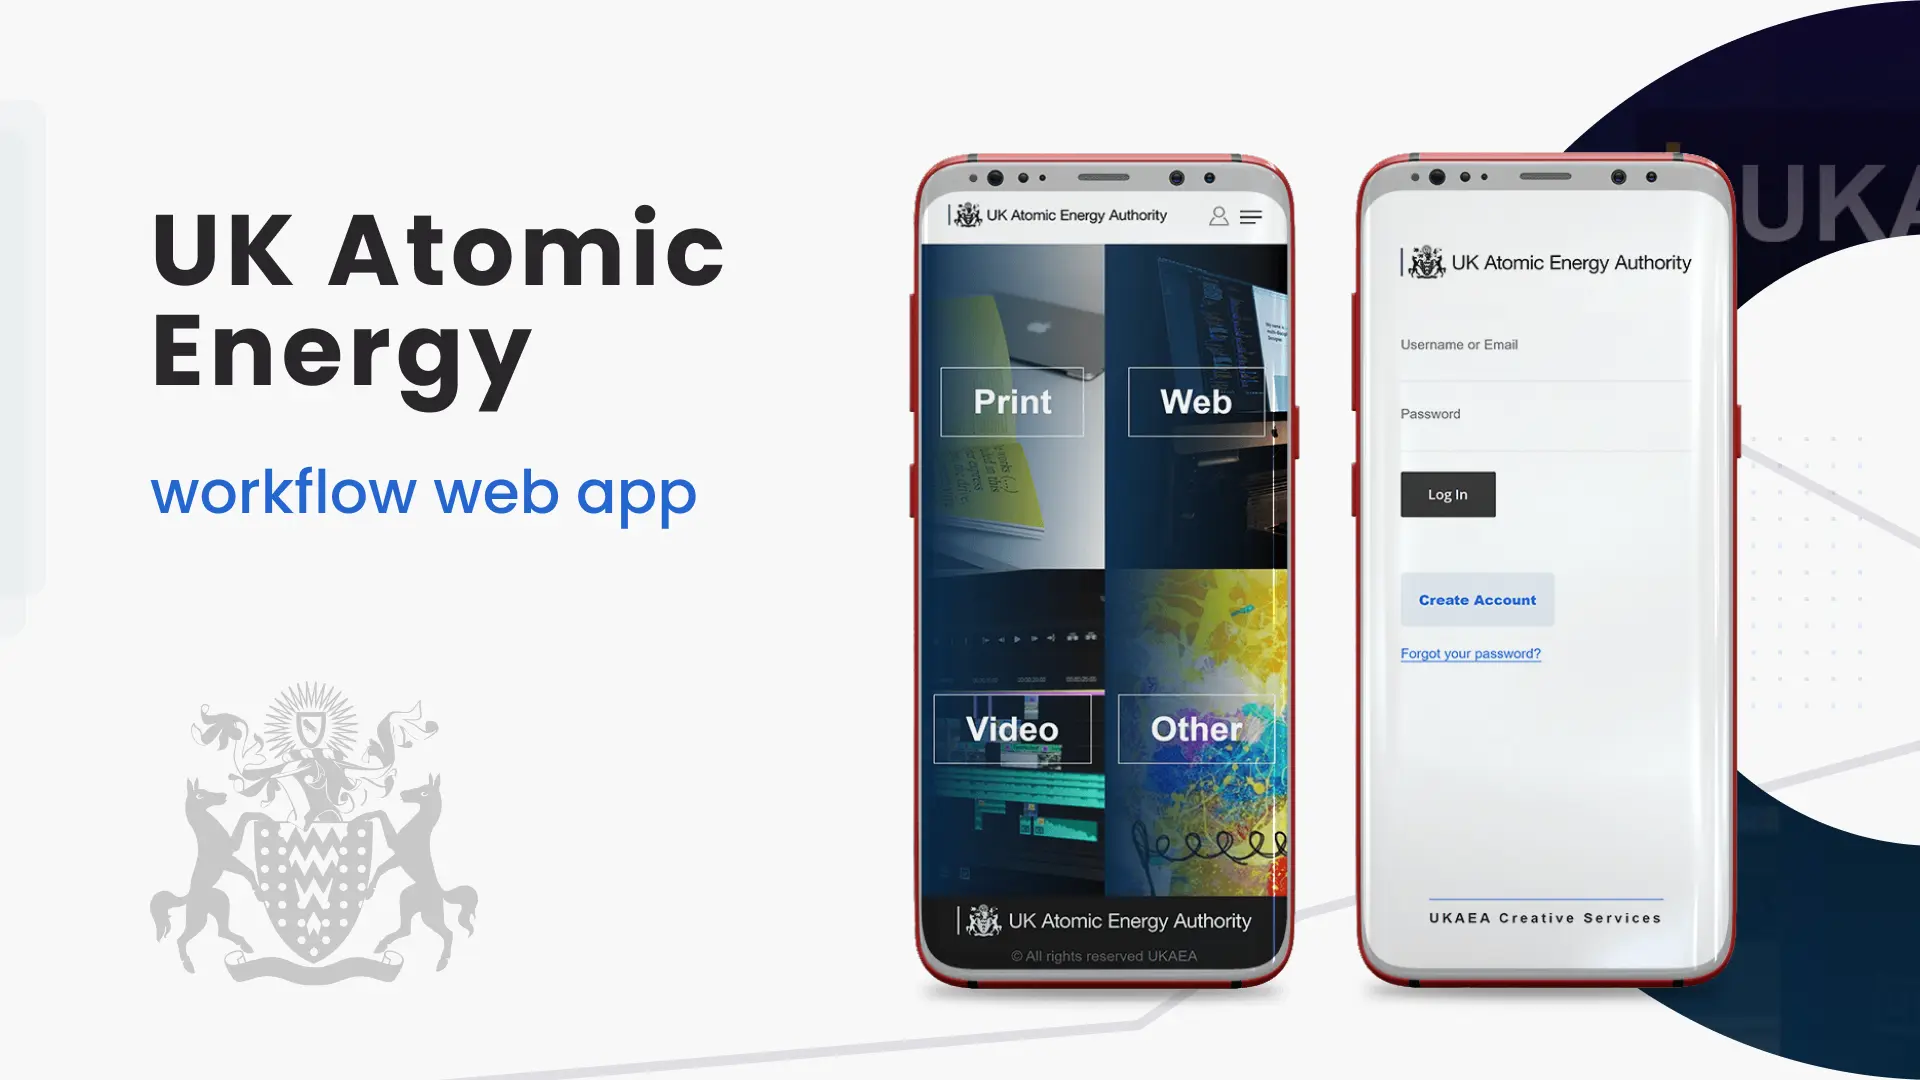
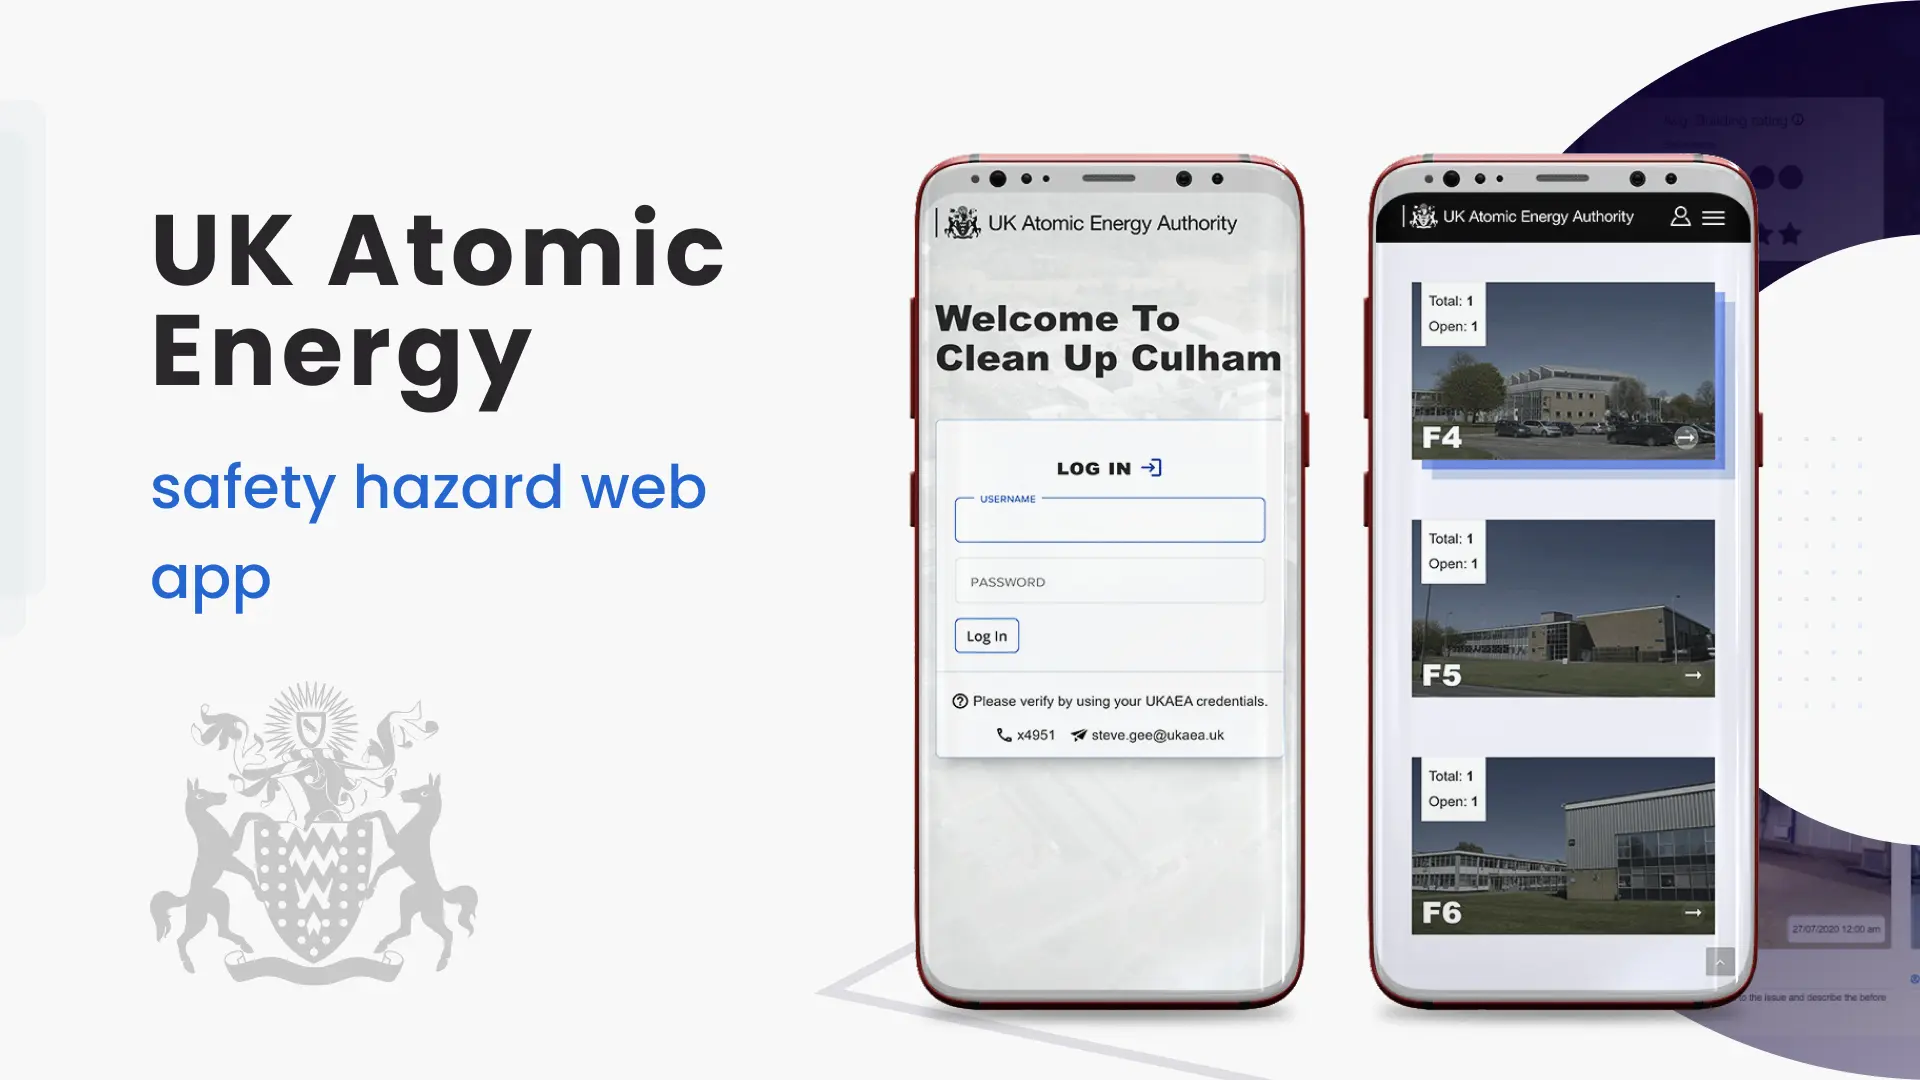
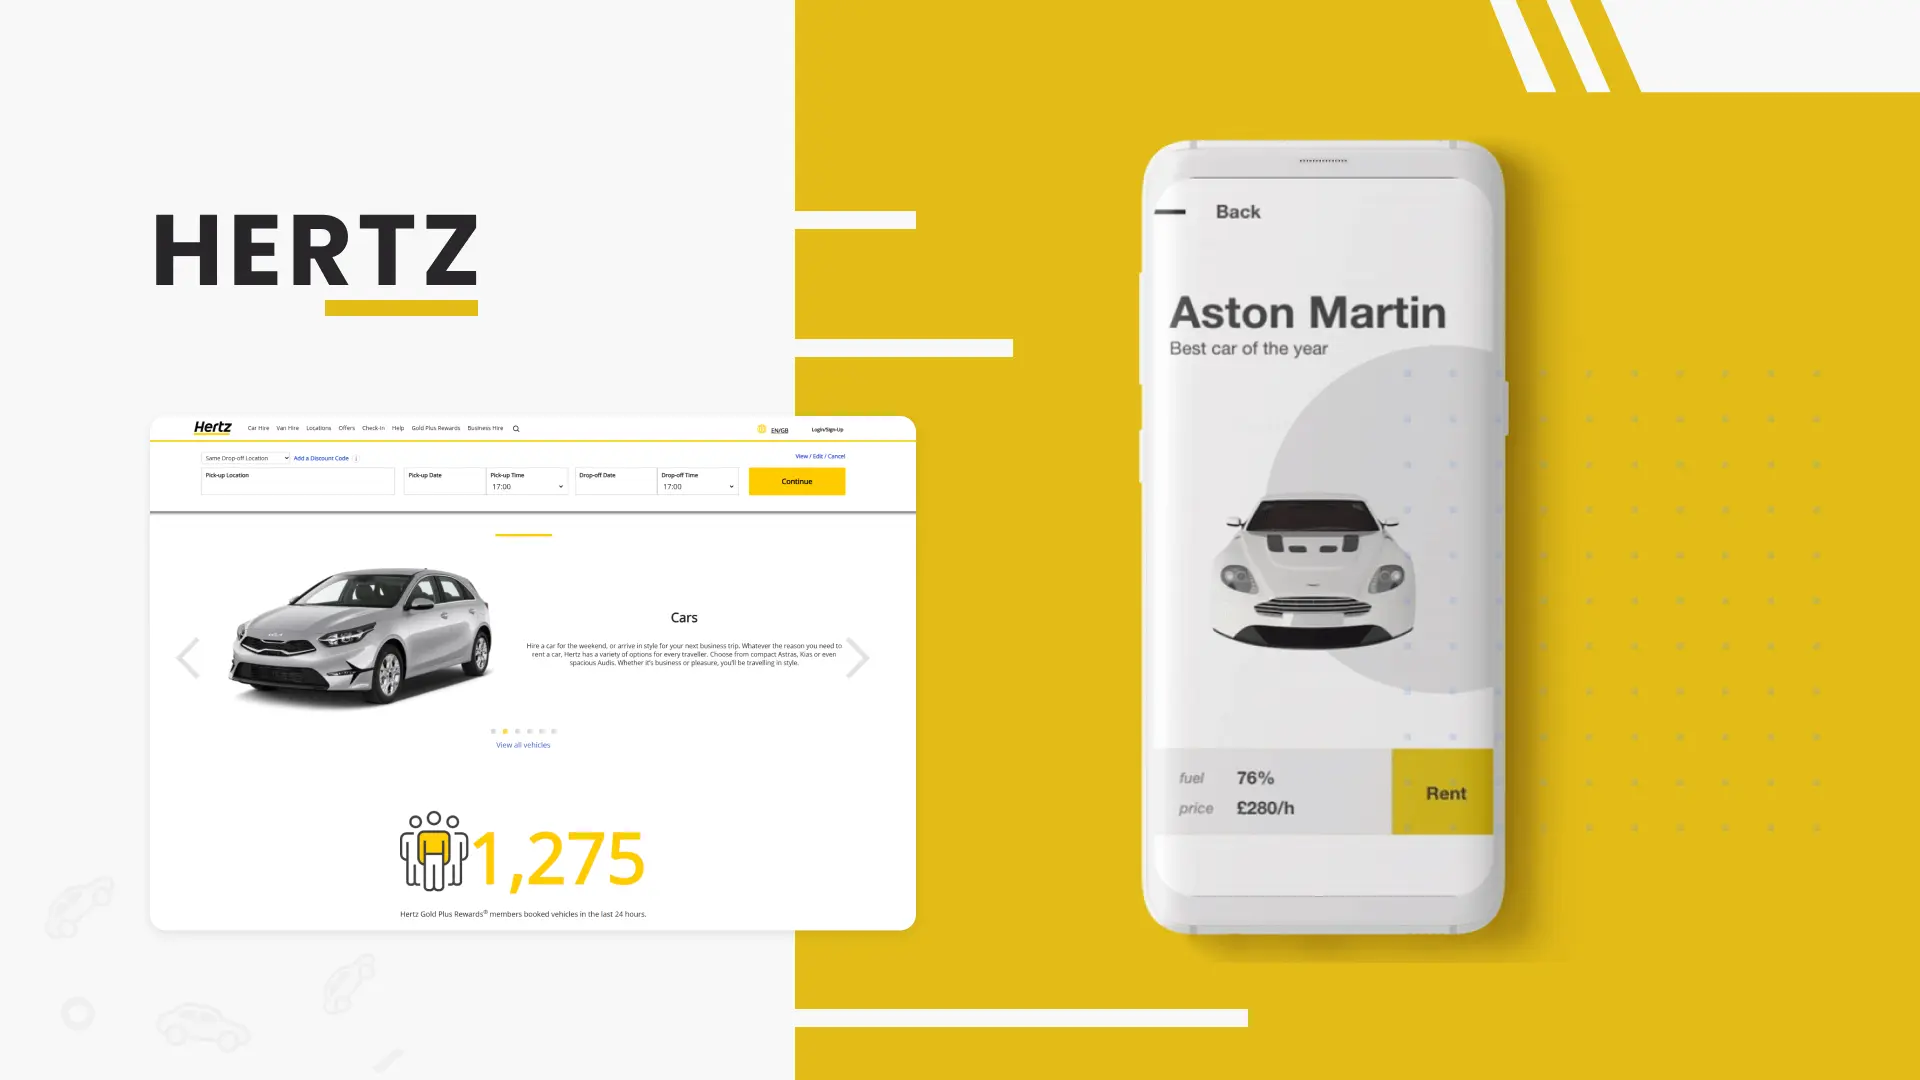
Projects worked
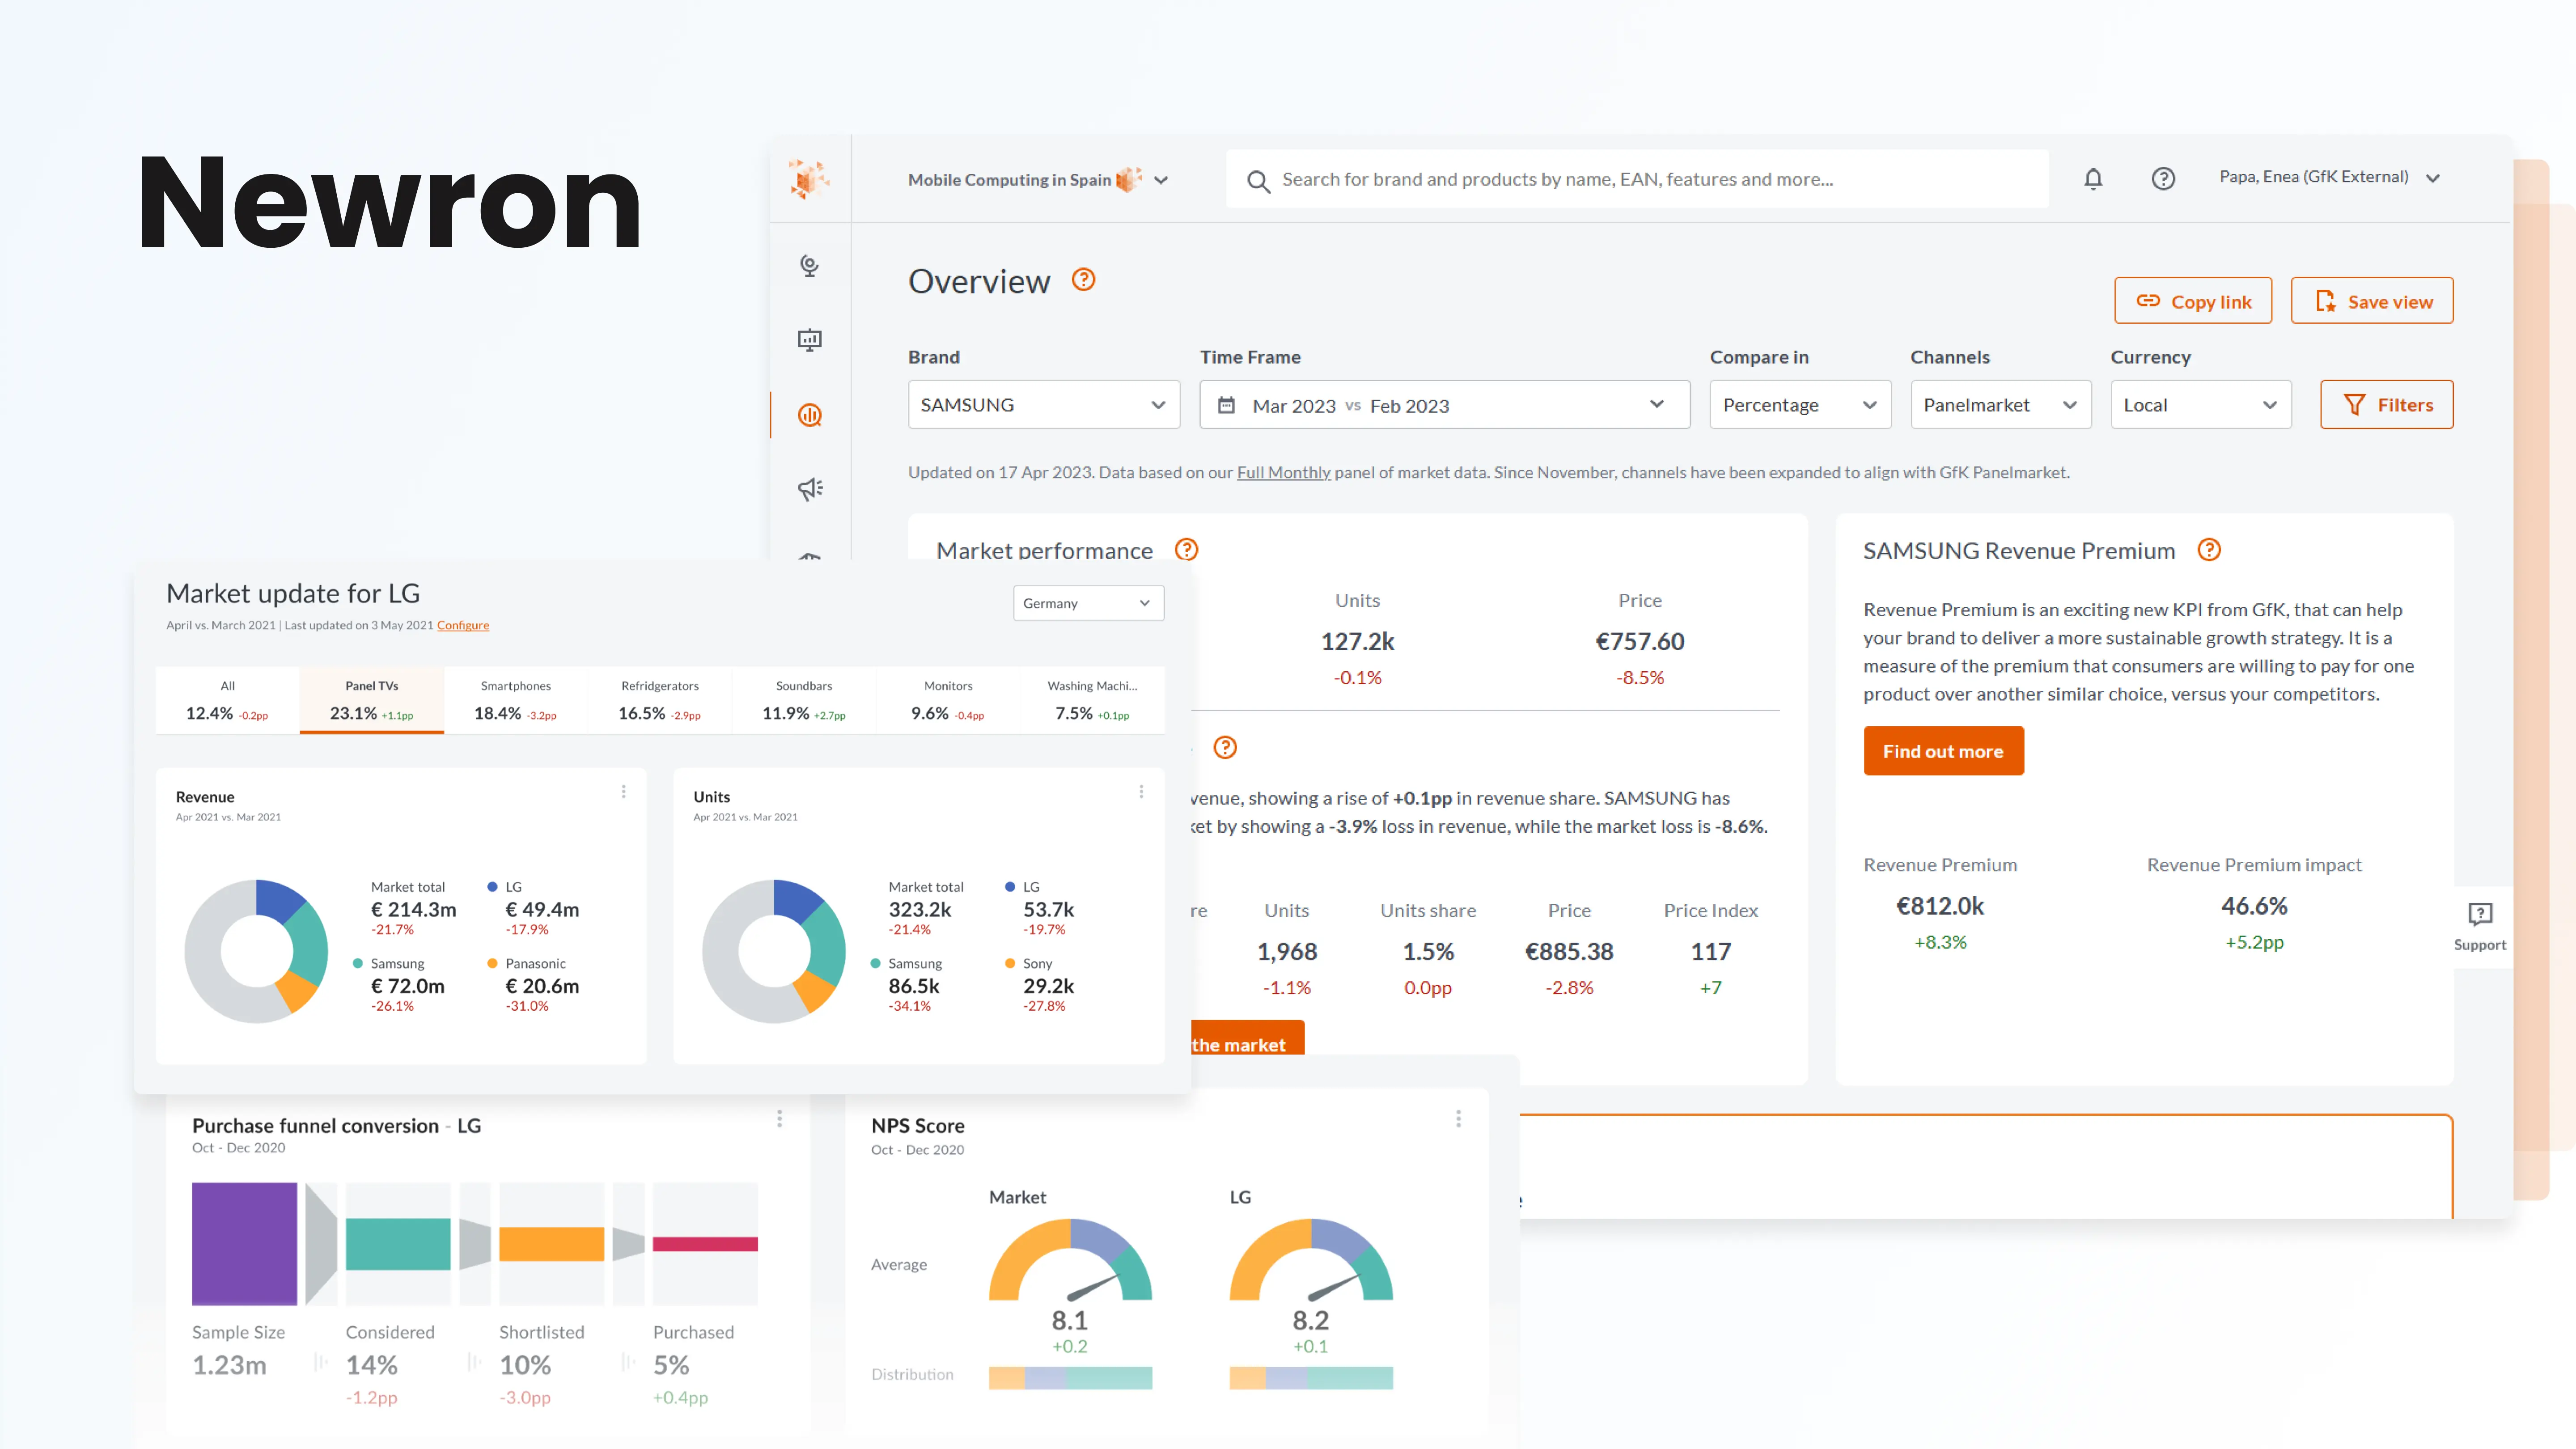
Newron is a data platform provider that helps you understand and influence the future of your market. It integrates data from various sources, such as market trends, consumer behaviour and brand performance, and uses AI to provide actionable insights and recommendations.
This product came to life through a mix of creativity and hard work, involving multiple stages of design thinking, research, and both setbacks and successes. We used various methods and tools to really get a feel for what our users need and prefer.
When I joined GFK as the Lead Product Designer, my goal was to reshape the product vision, introduce fresh ideas, and suggest new workflow methodologies.
In my role, I worked closely with cross-functional teams—including project managers, UI/backend developers, data scientists, and others—to identify problems, conduct research, brainstorm solutions, and create prototypes.
I can't go into detail about every Jira project or task I tackled, but I'd love to share a specific project to give you an idea of my work.
Newron Dummy data
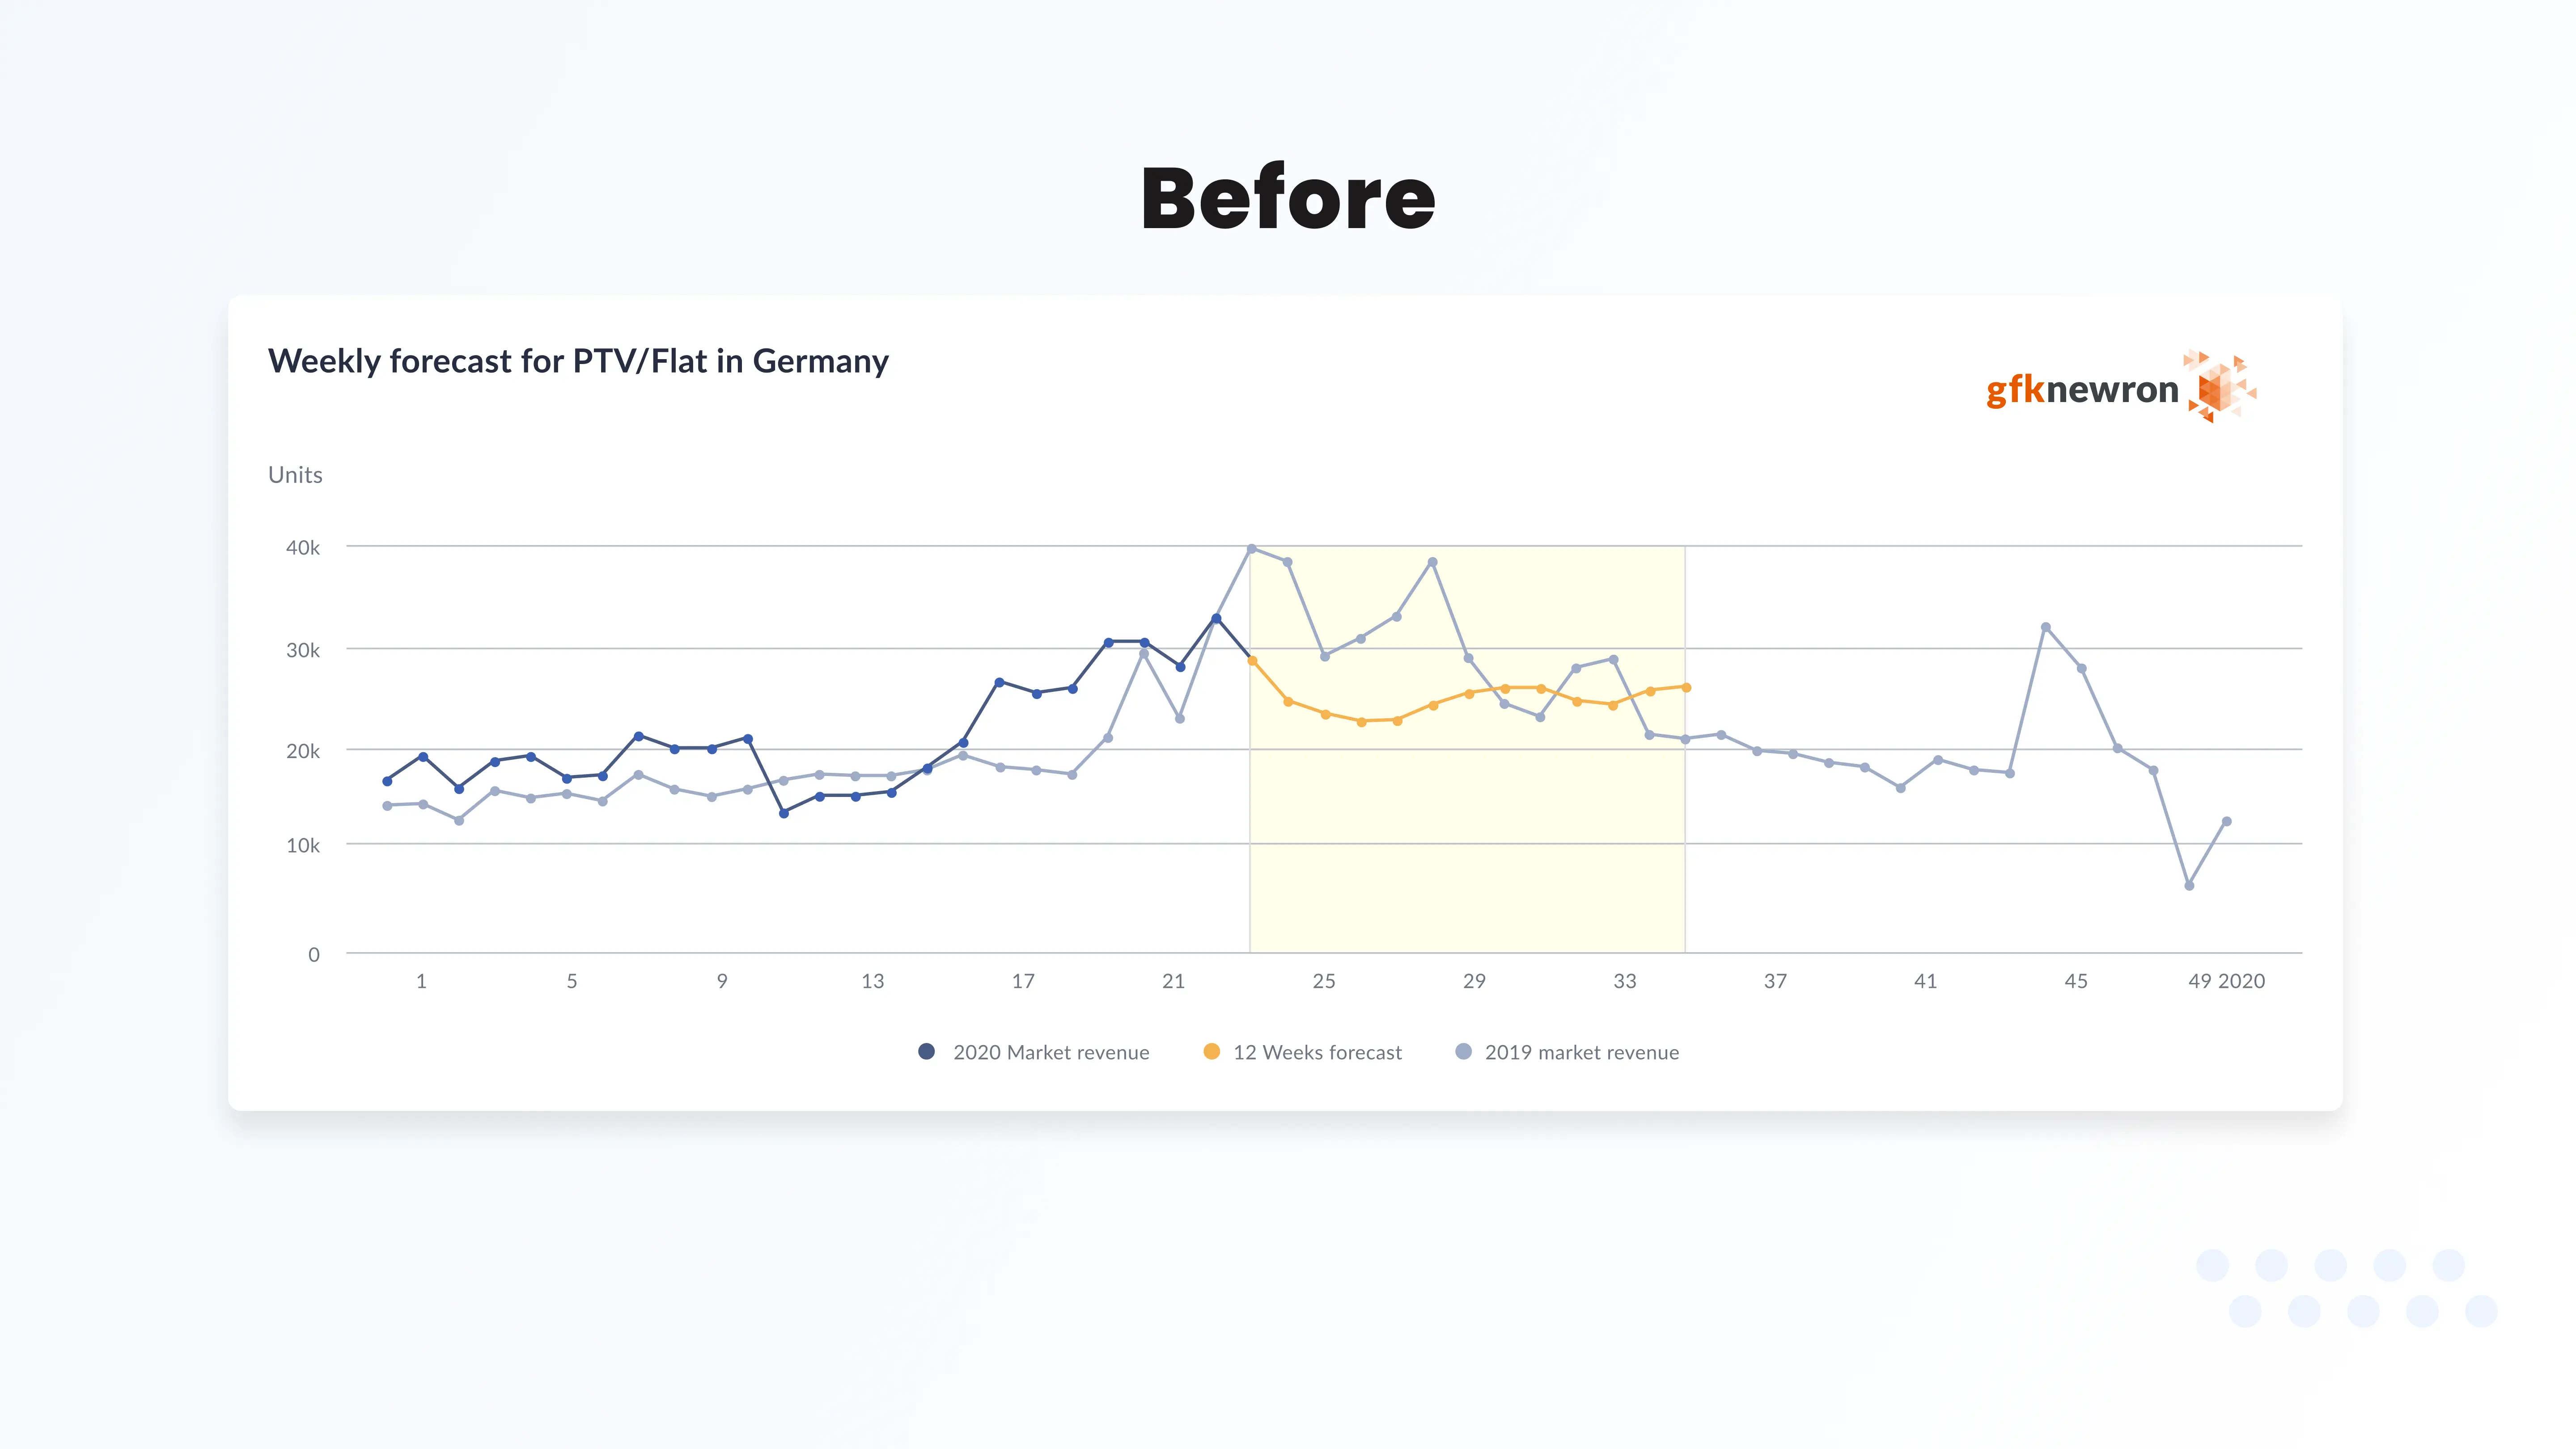
Forecasting is advanced software that uses four years of data and machine learning to make future predictions. It has a personalized AI interface that offers tailored insights and recommendations.
Though still in development, Forecasting attracted high user interest. Initially free with other subscriptions, GFK later made it a standalone, subscription-based module.
Despite its popularity, a high bounce rate was a concern. I suggested user research to identify what was working, what wasn't, and what features were needed.
The team
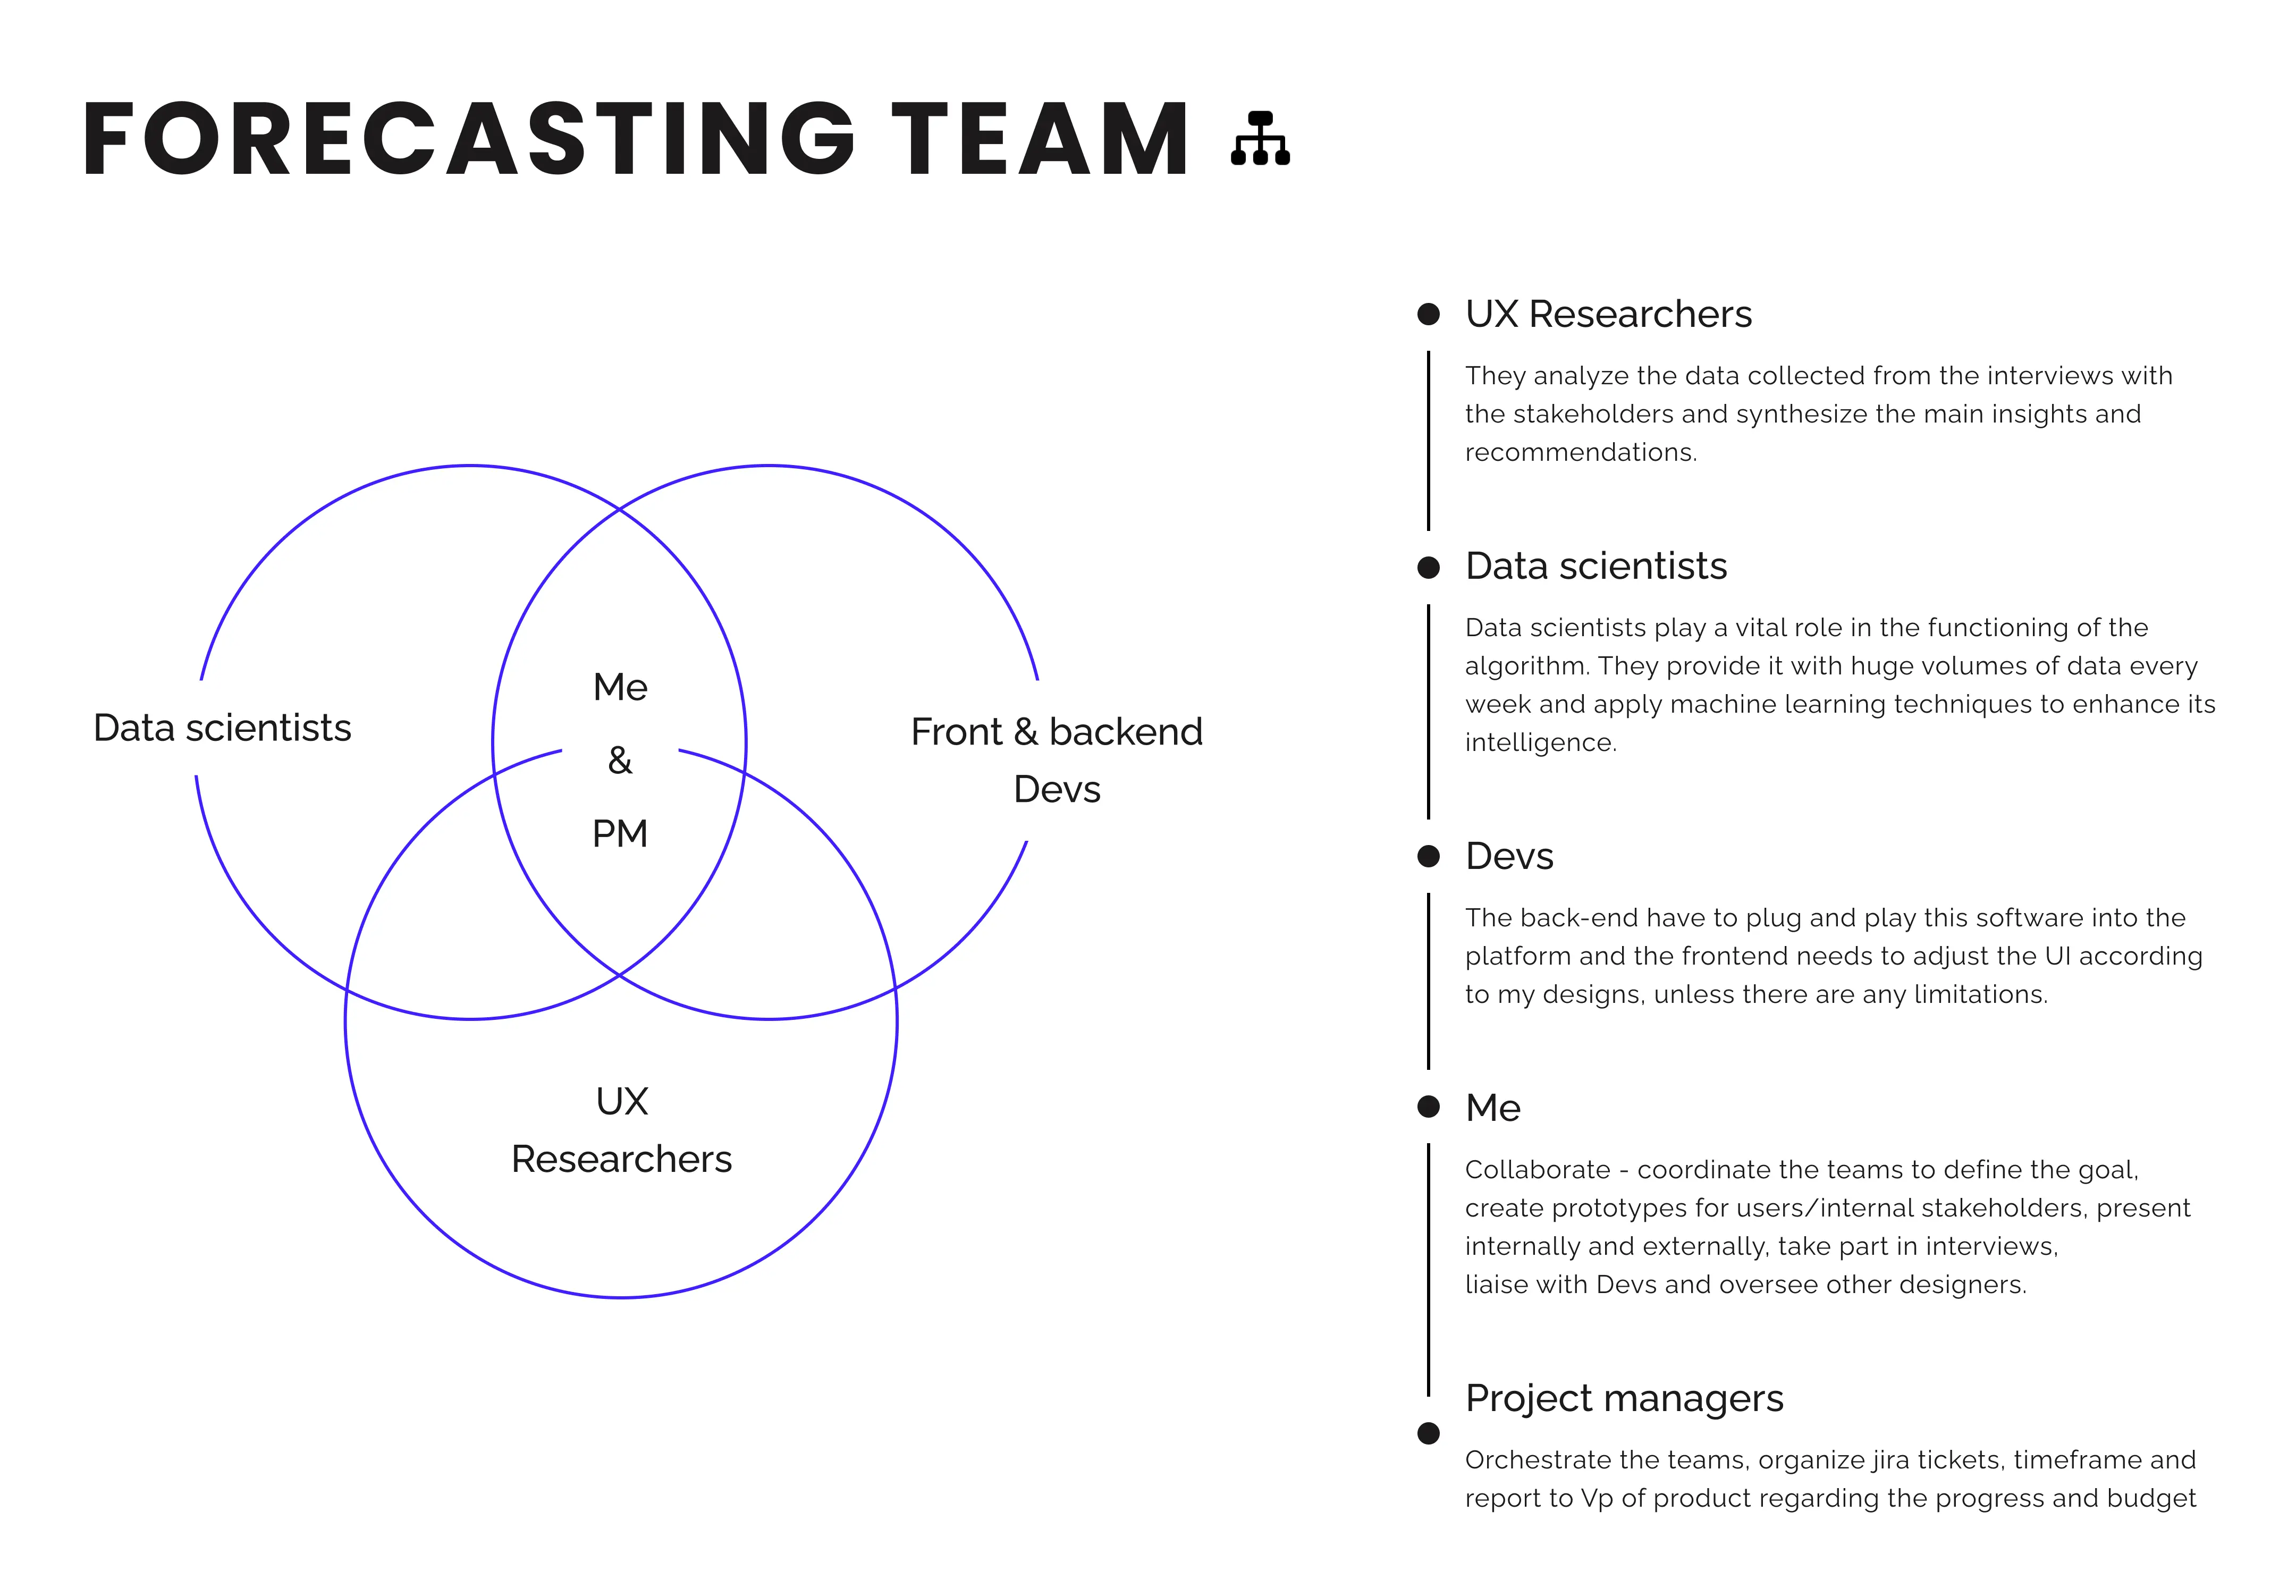
Initially, bridging the communication gap between departments was challenging. Recognizing the need for unity to reach our shared goals, I introduced strategies to enhance teamwork. This included efficient meetings that respect everyones energy, transparent communication through shared Slack channels and clear milestones. Consequently, this fostered a more integrated approach towards our collective objectives
The method
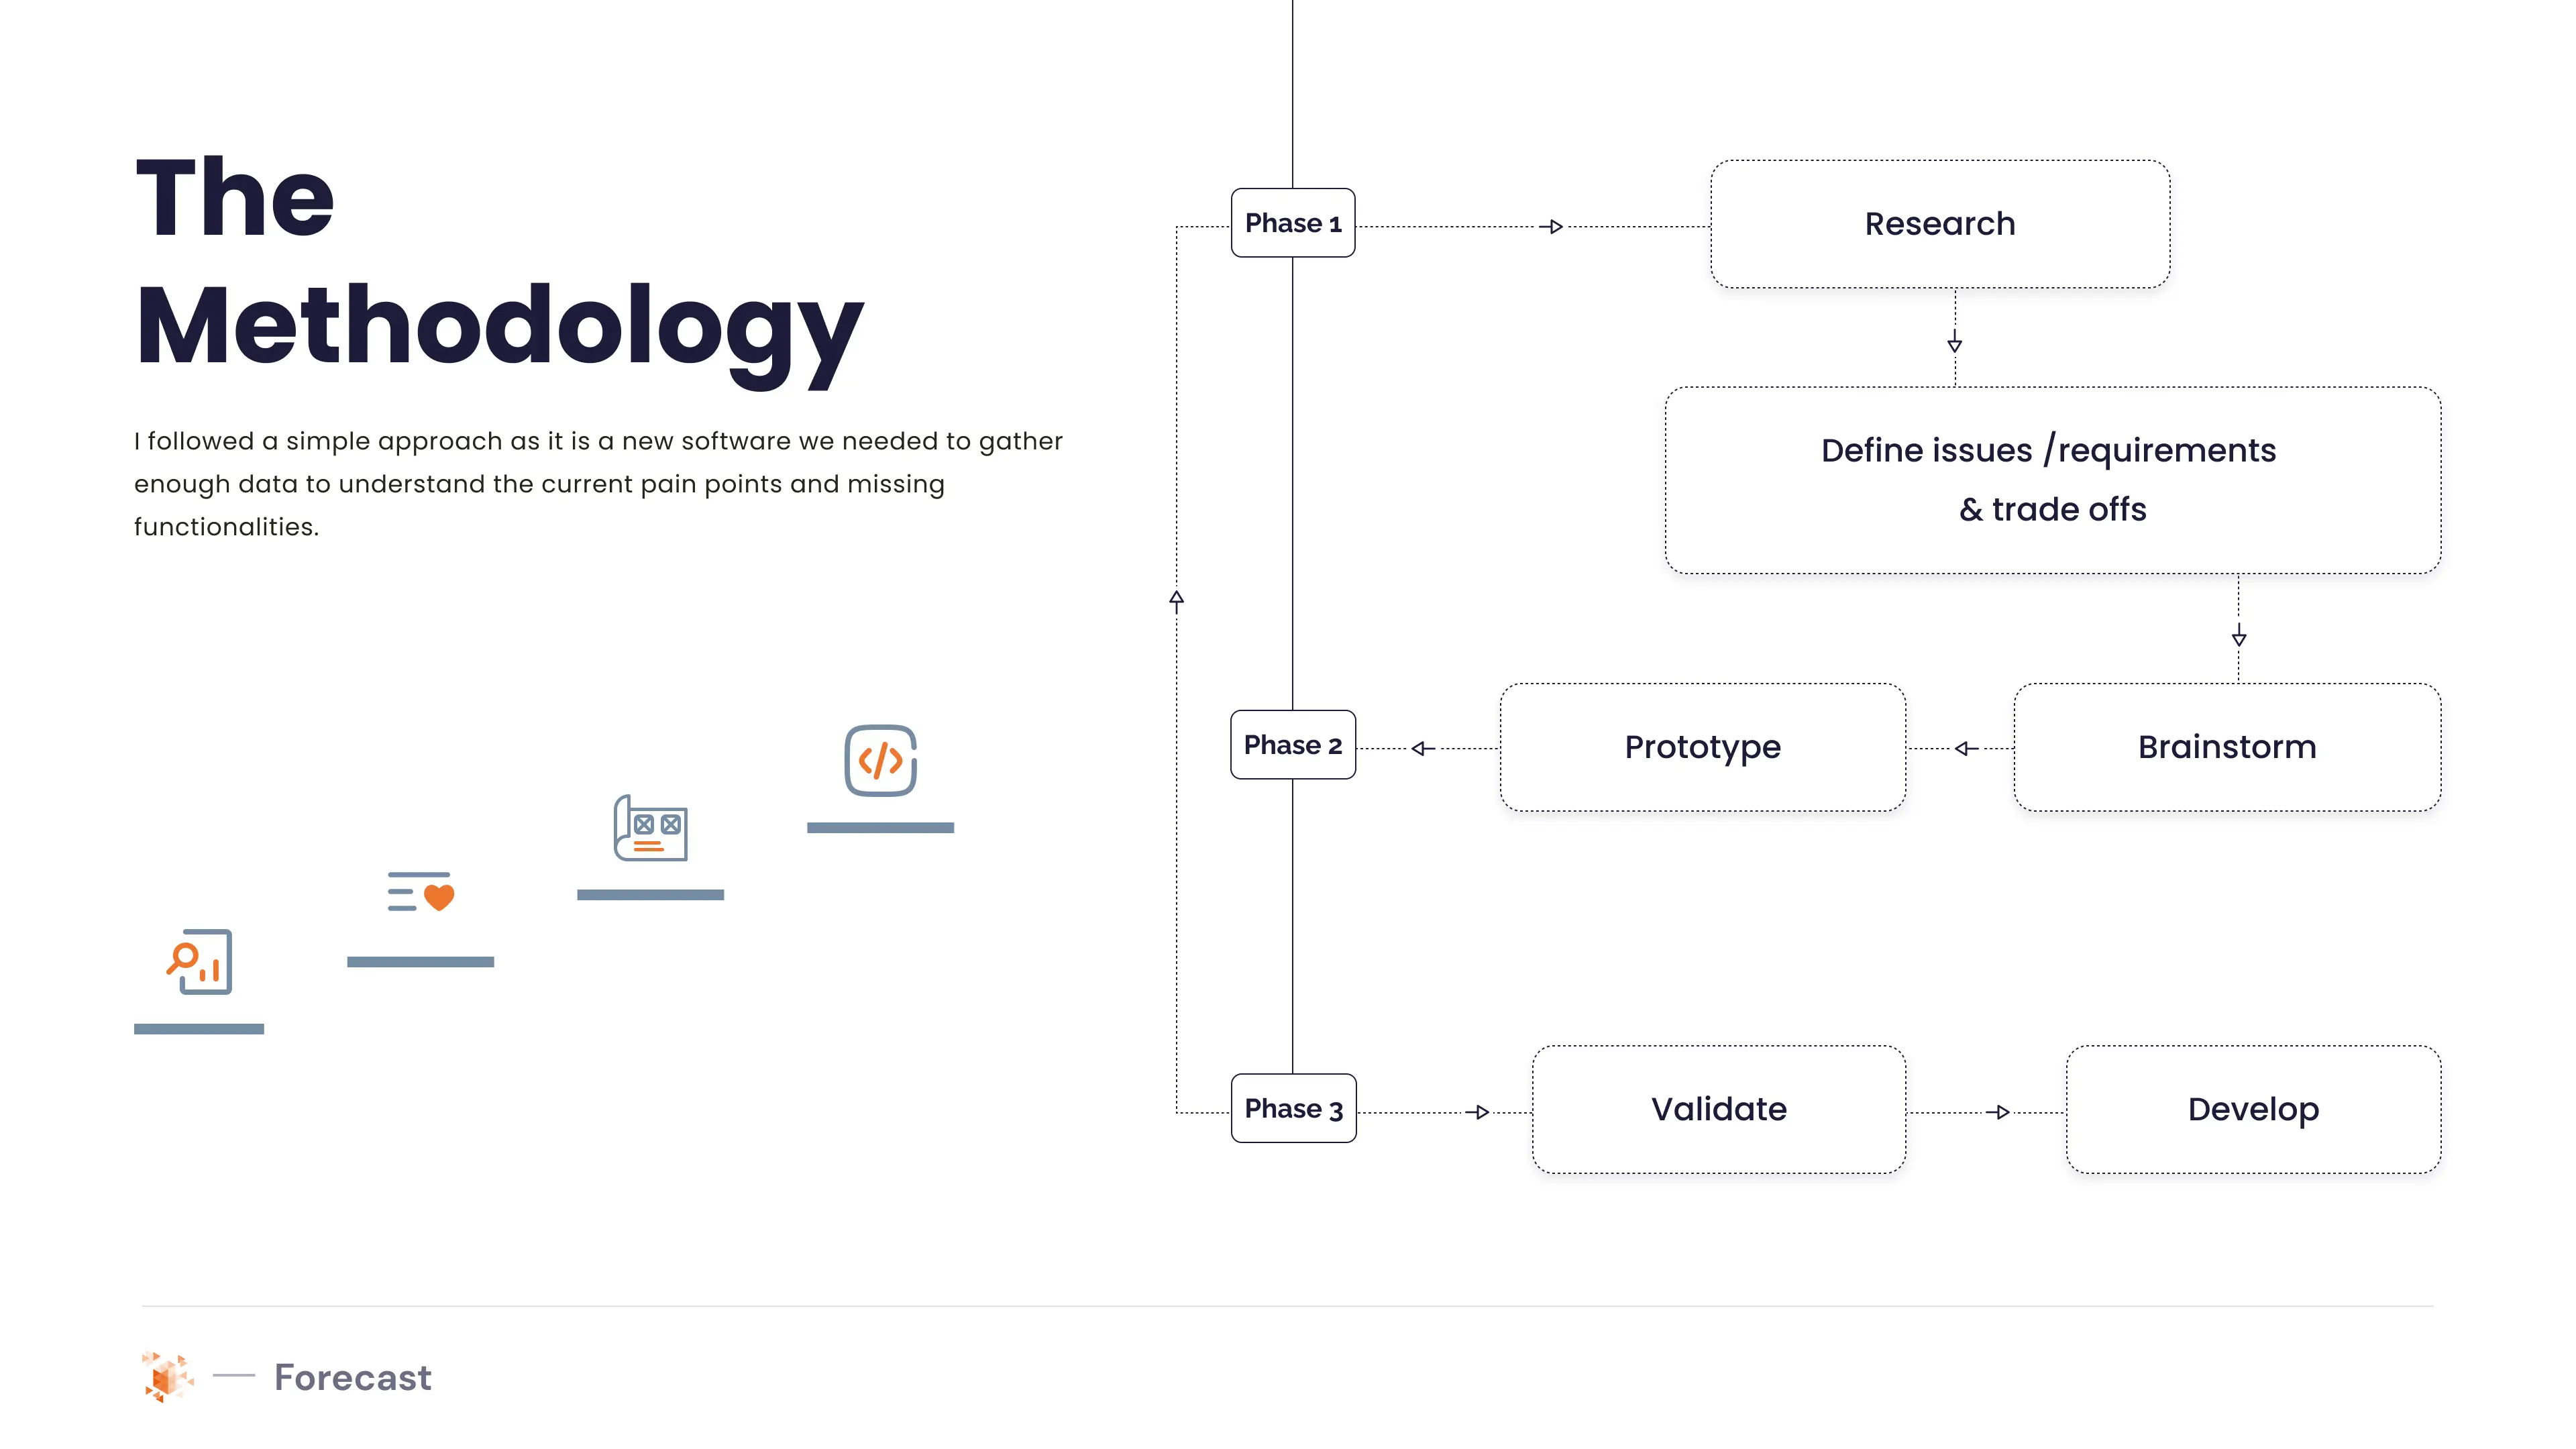
Goals:
To kick off the project, I conducted lots of interviews with different users from various companies that expressed interested into forecasting, to understand what was working well and what needed improvement. My strategy is to always put the user at ease and make the interview enjoyable like a casual conversation.
The interviews
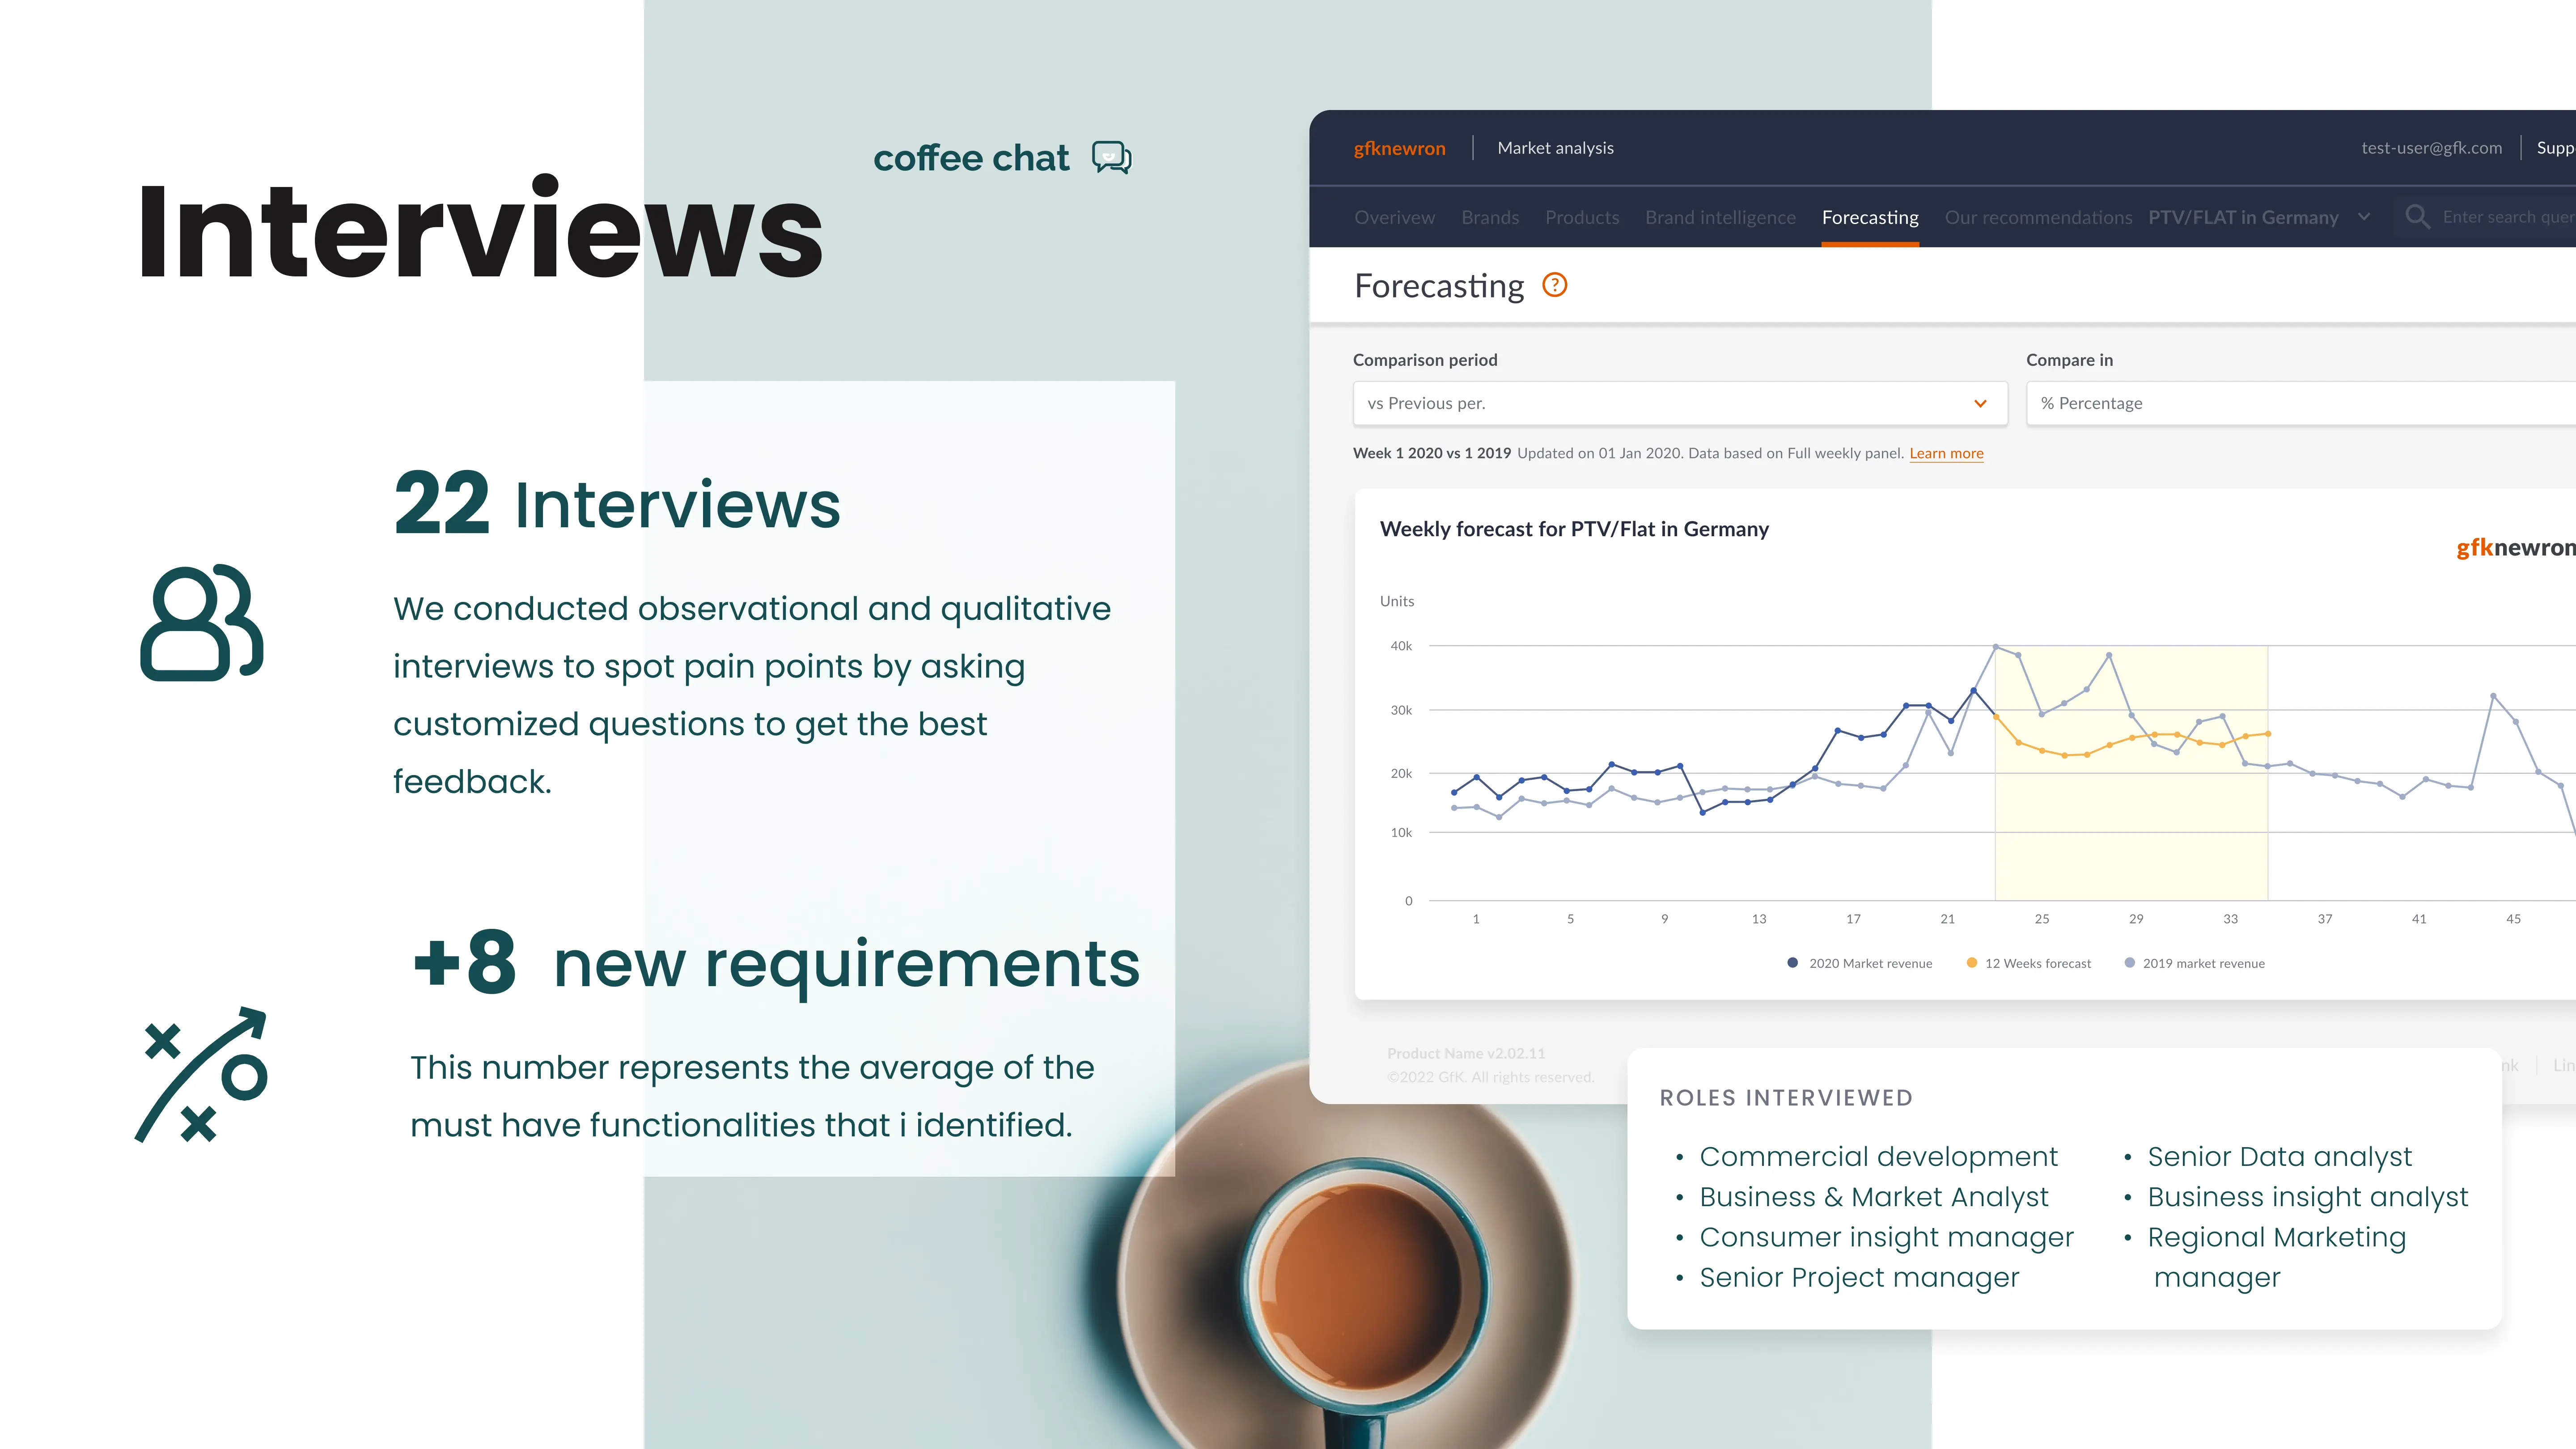
By the end of the interviews, we had a clear vision of which direction we should head. All we needed was to apply our new knowledge in designs (wireframes, prototypes)
Phase 2In my experience, it’s best to have developers and data scientists join important meetings from the start. They can give their thoughts early on, help us figure out if our ideas will work, and what they might cost. This keeps most updated and keeps everyone moving in the same direction.
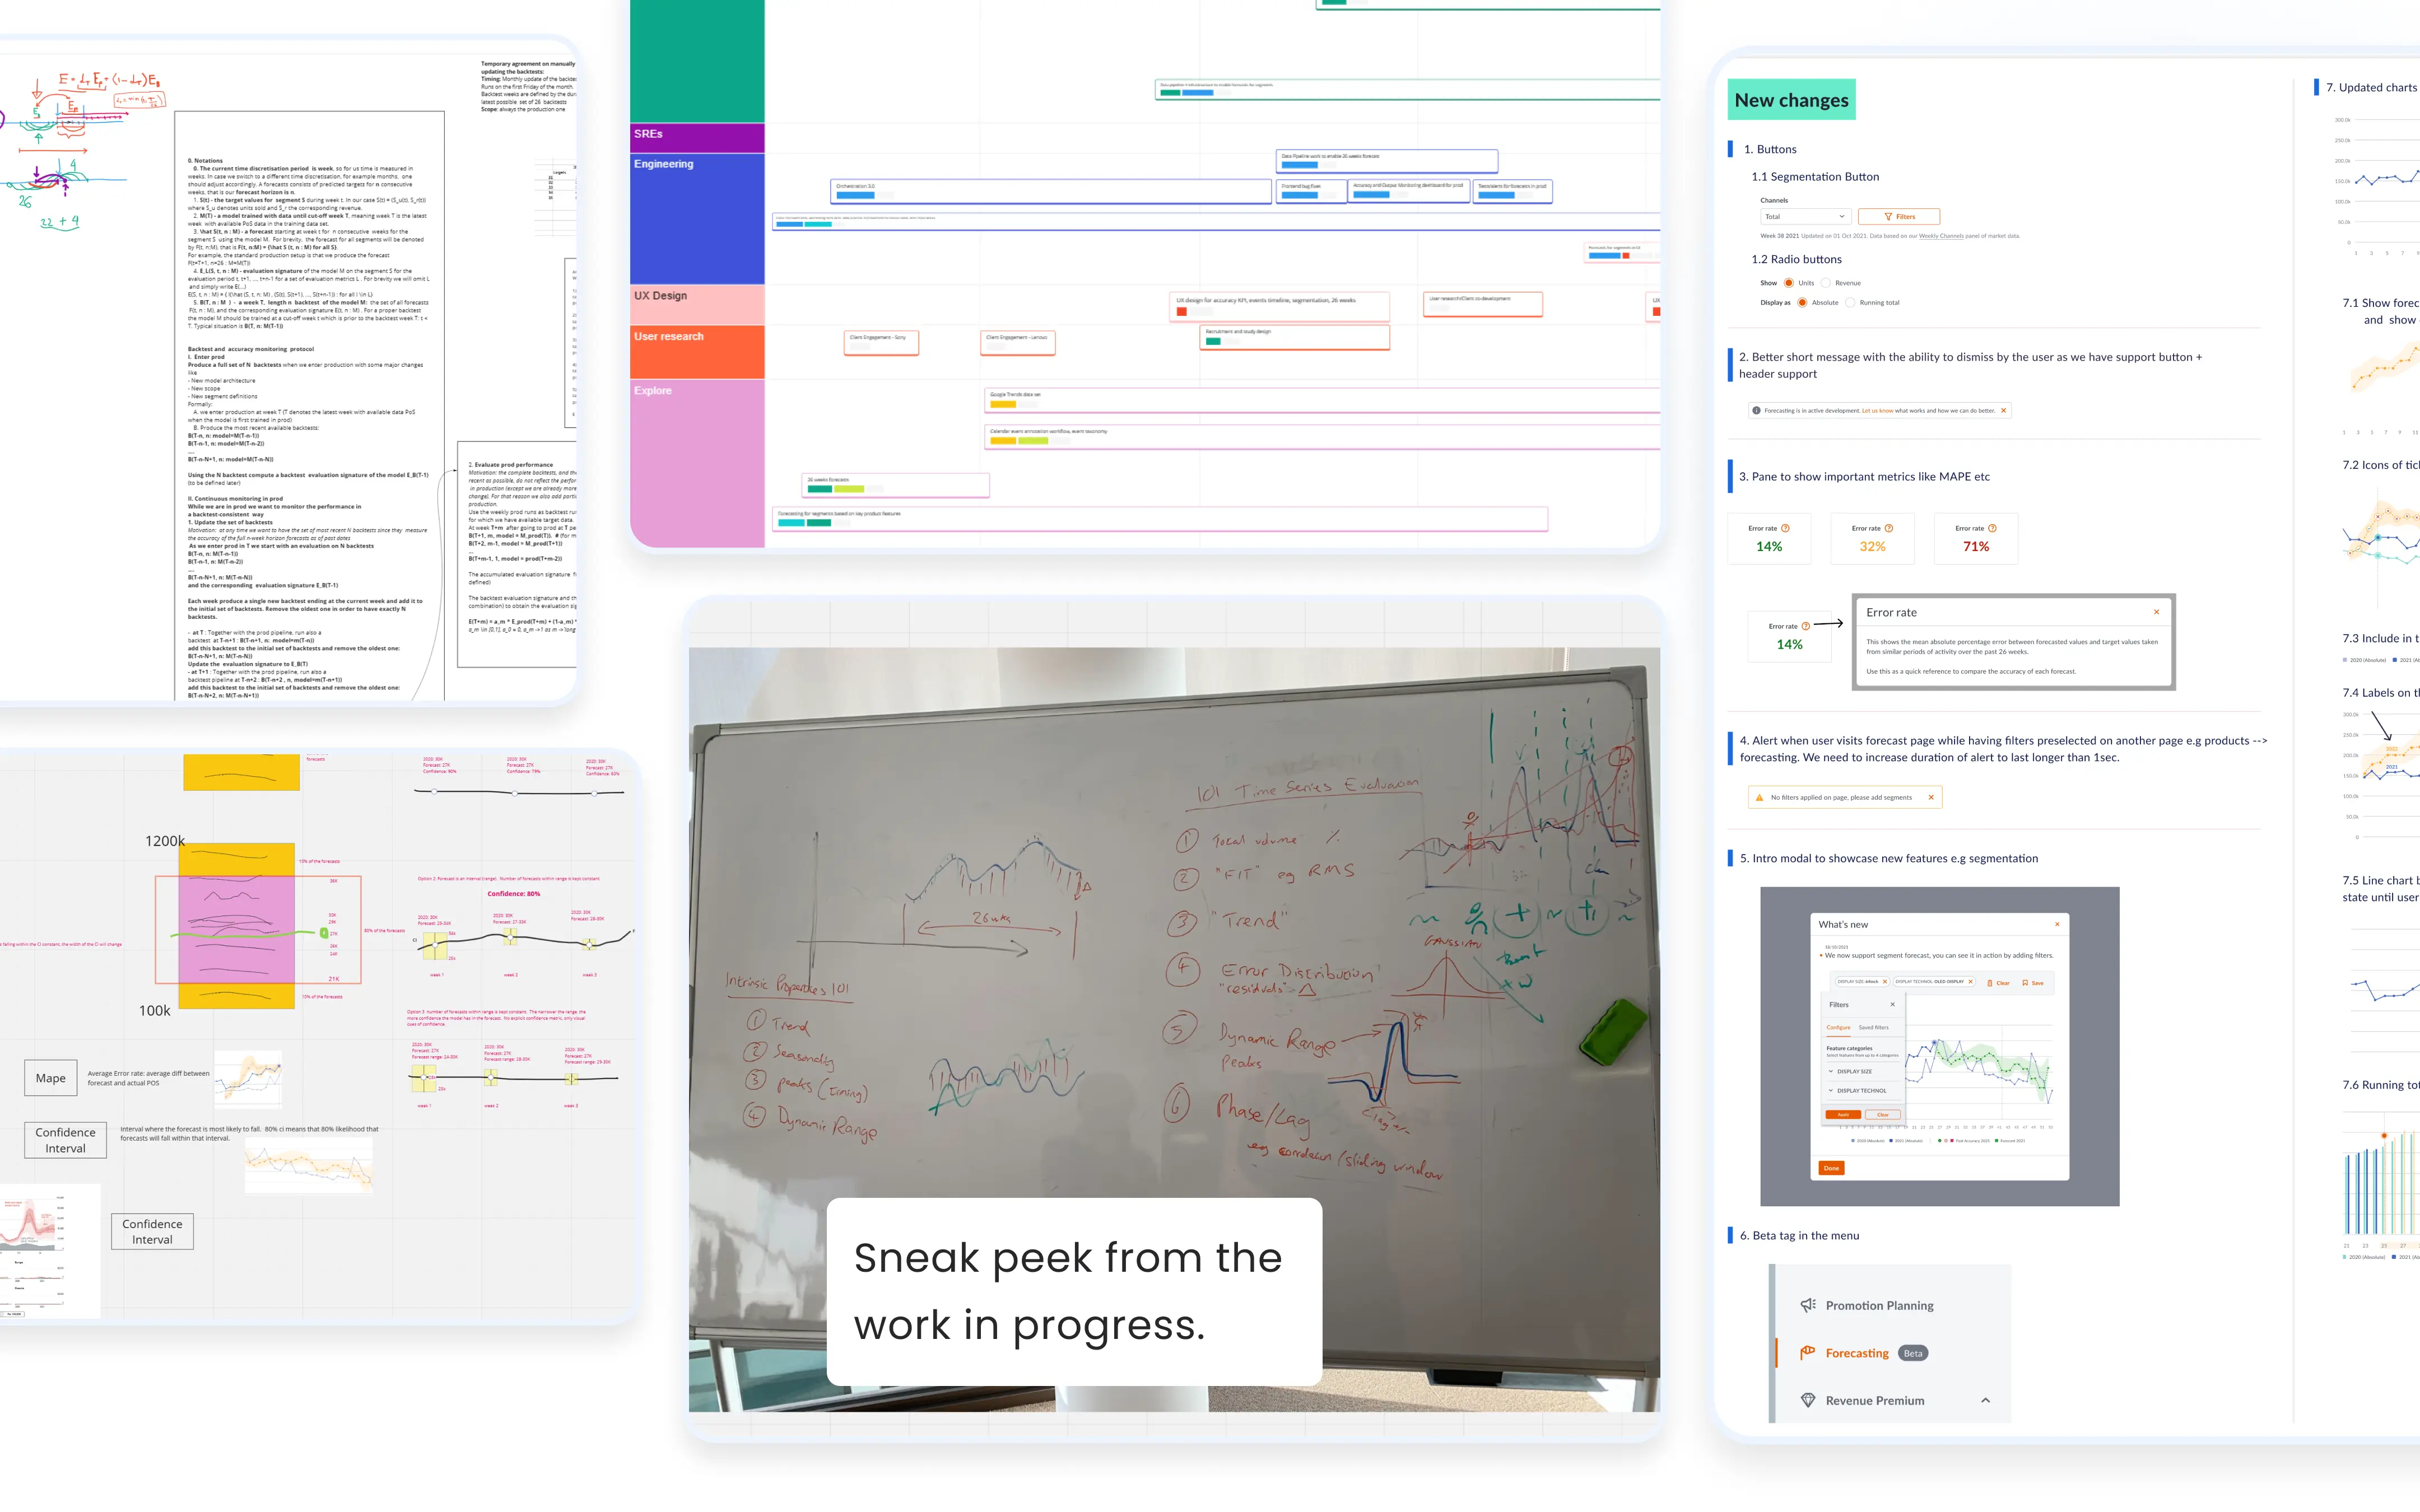
So, we spent the second phase brainstorming and refining ideas with designers and the team. By the end, I had a Figma prototype ready to show a few clients for their feedback.
The prototype
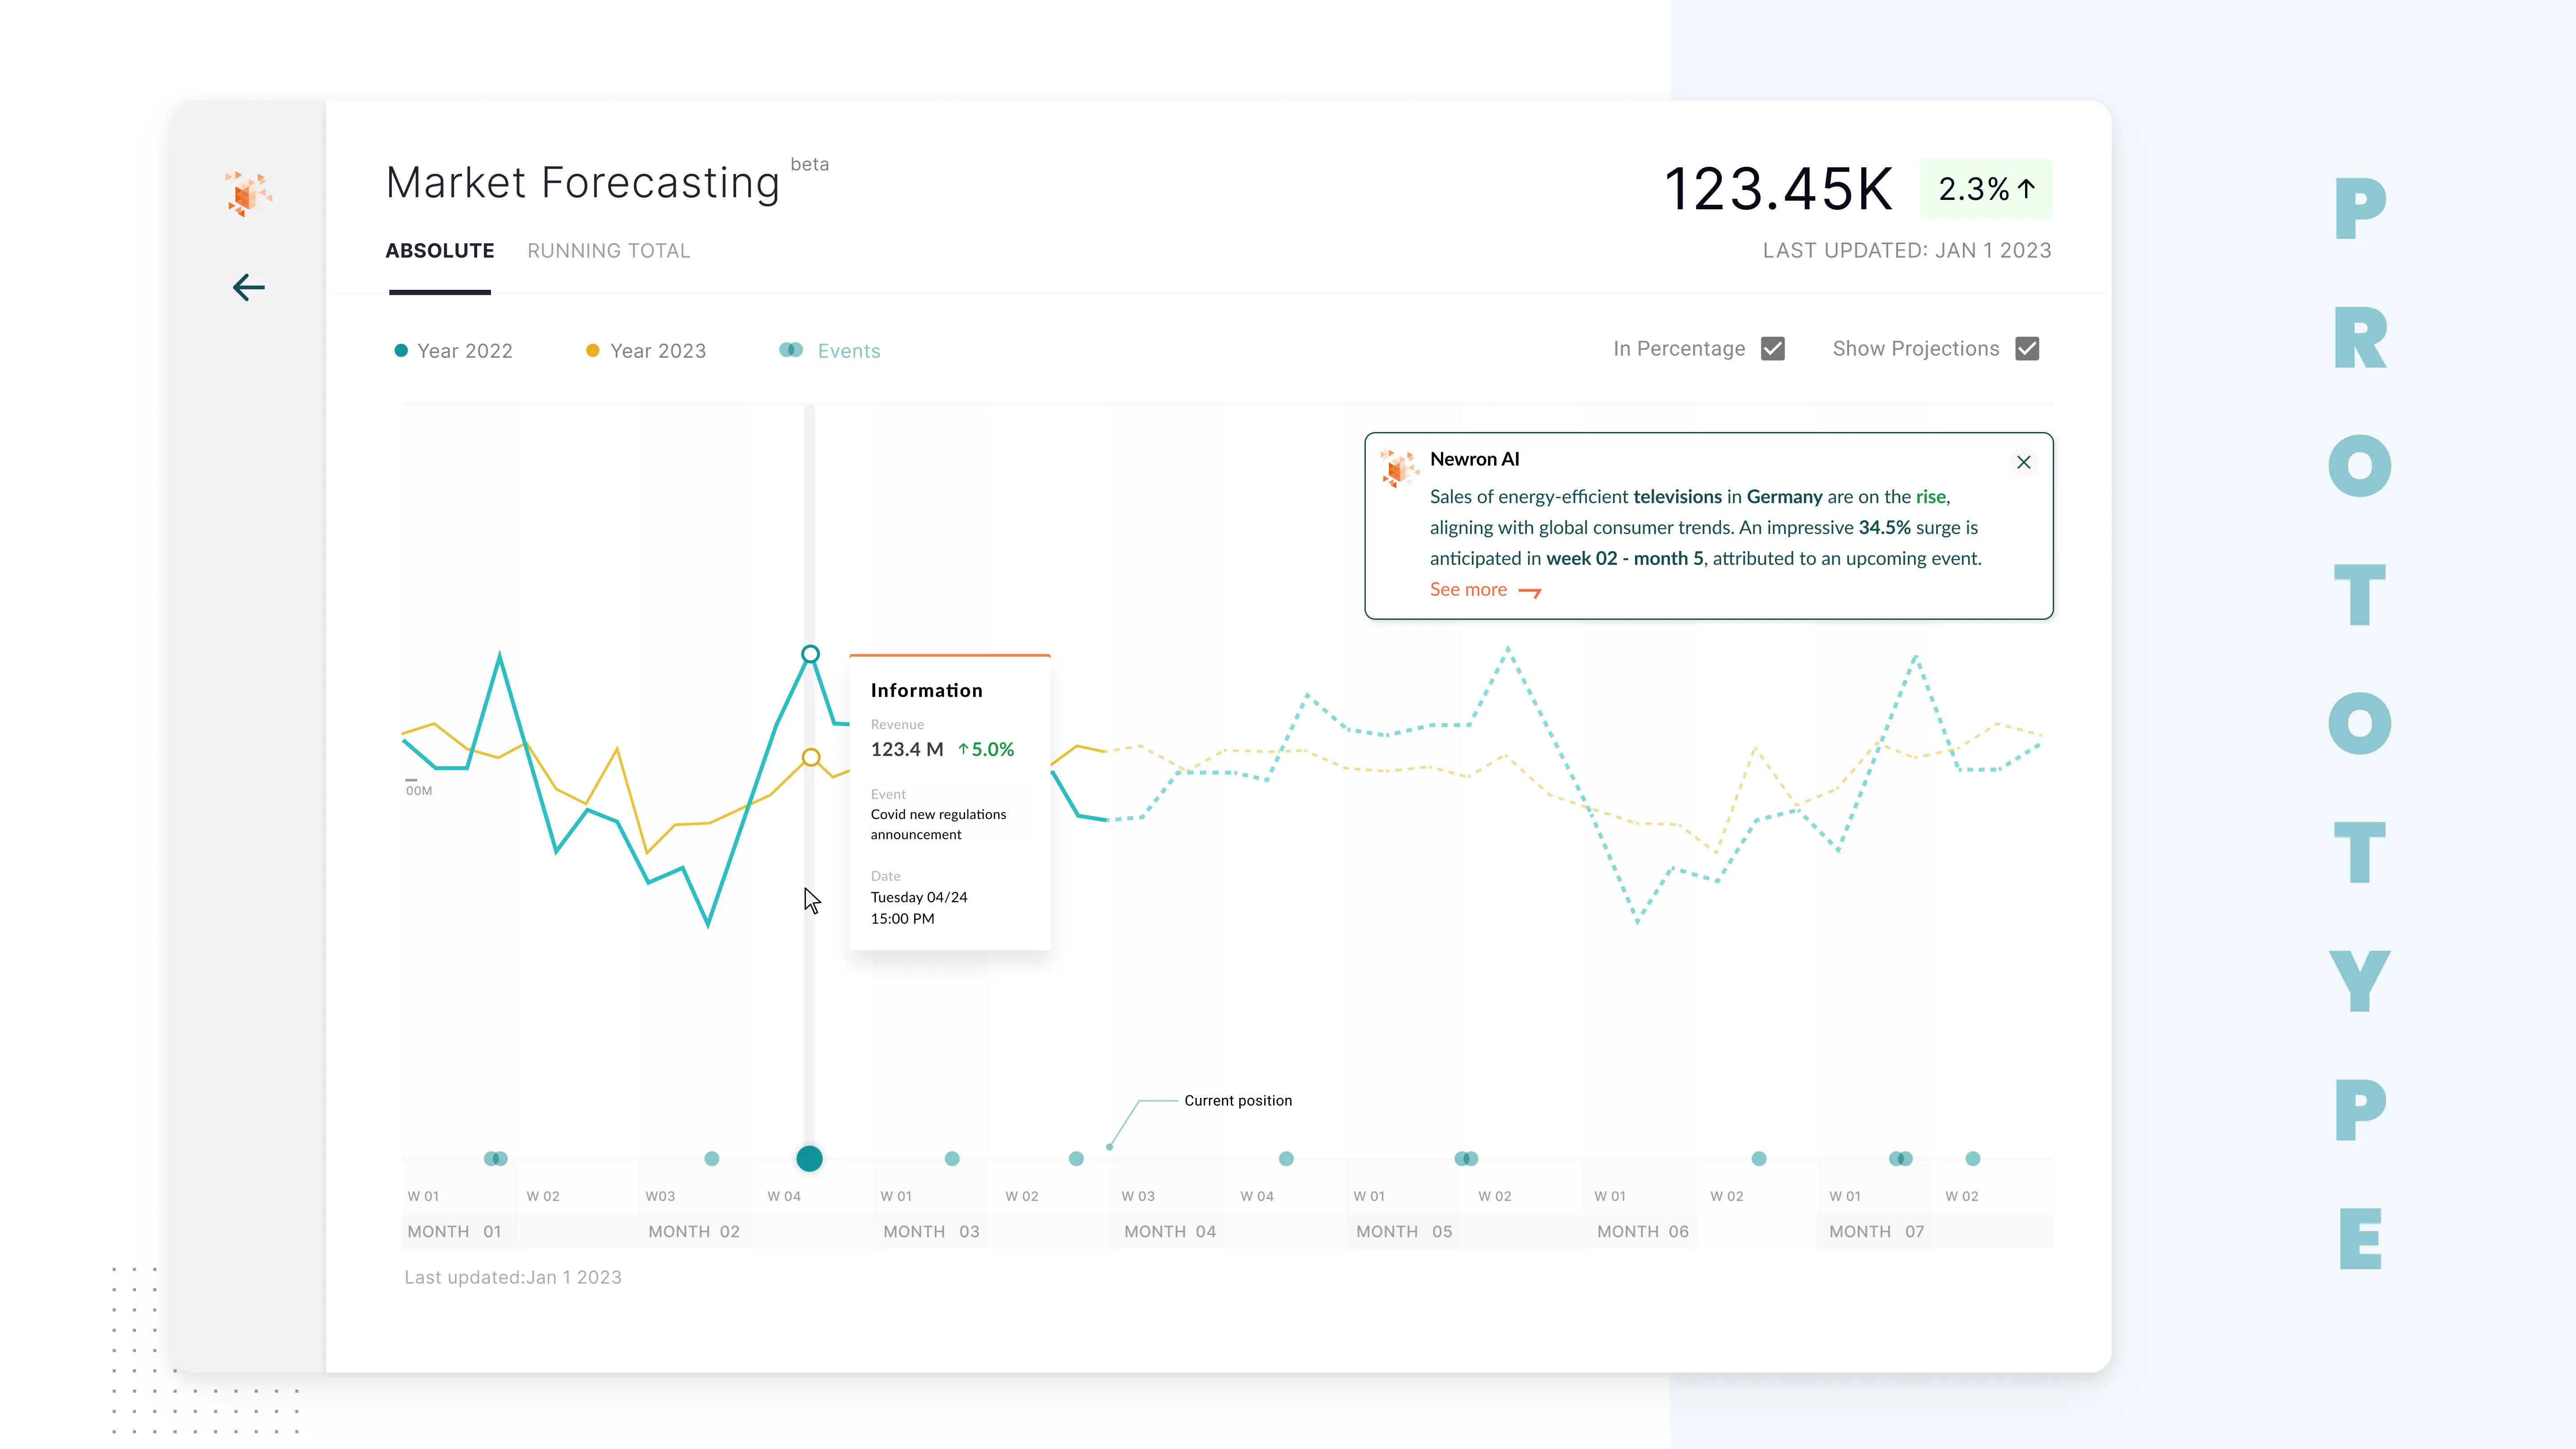
We were pleased with the positive feedback on our first prototype. It tested users with real-life problem scenarios tailored to the market or business that made them think and be creative. For instance, we had them guess future market trends using different data and then adjust a chart accordingly.
Thanks to being involved from the beginning, our developers knew just what to do. They handled what seemed like a tough job with ease.
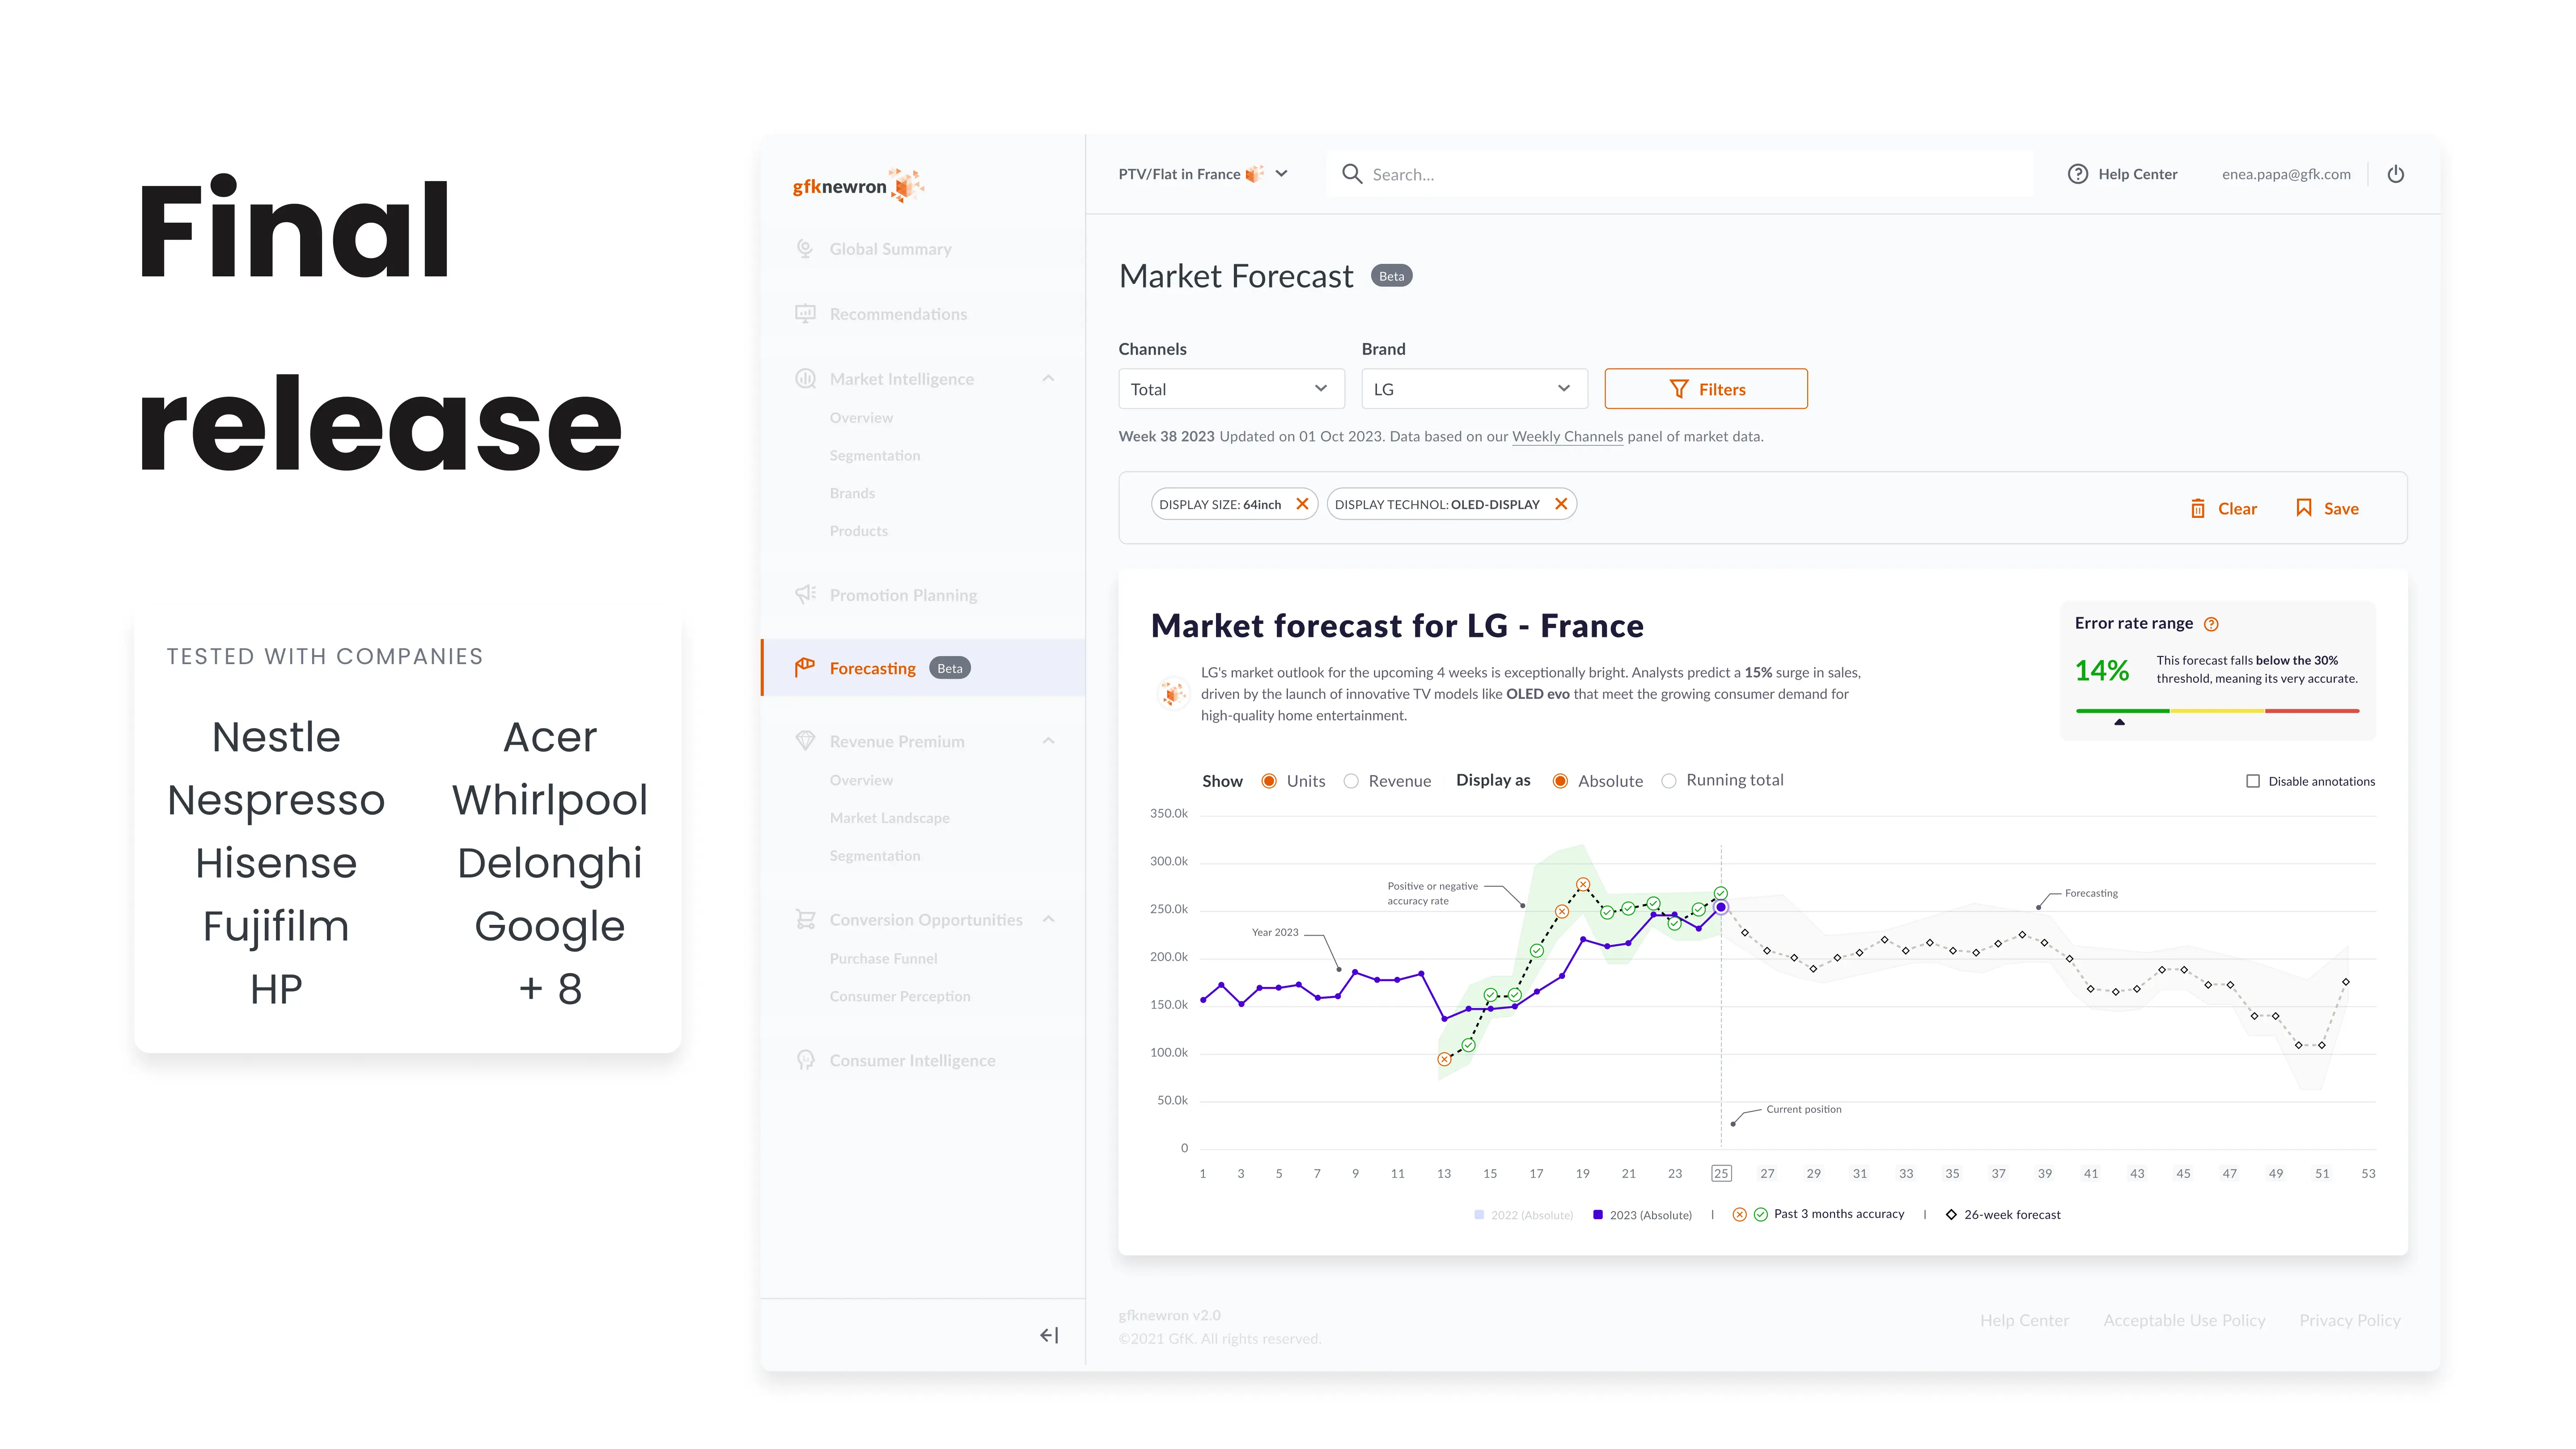
Phase 3After successful integration, the software seamlessly became a part of the platform, coexisting with the other software modules.
To promote the latest updates and encourage current users to subscribe to this new tool, we employed Shepherd JS—an introductory educational modal known for its high customizability. Additionally, we informed our Customer Success Managers (CSMs) about the significant release, empowering them to effectively upsell this innovative module.
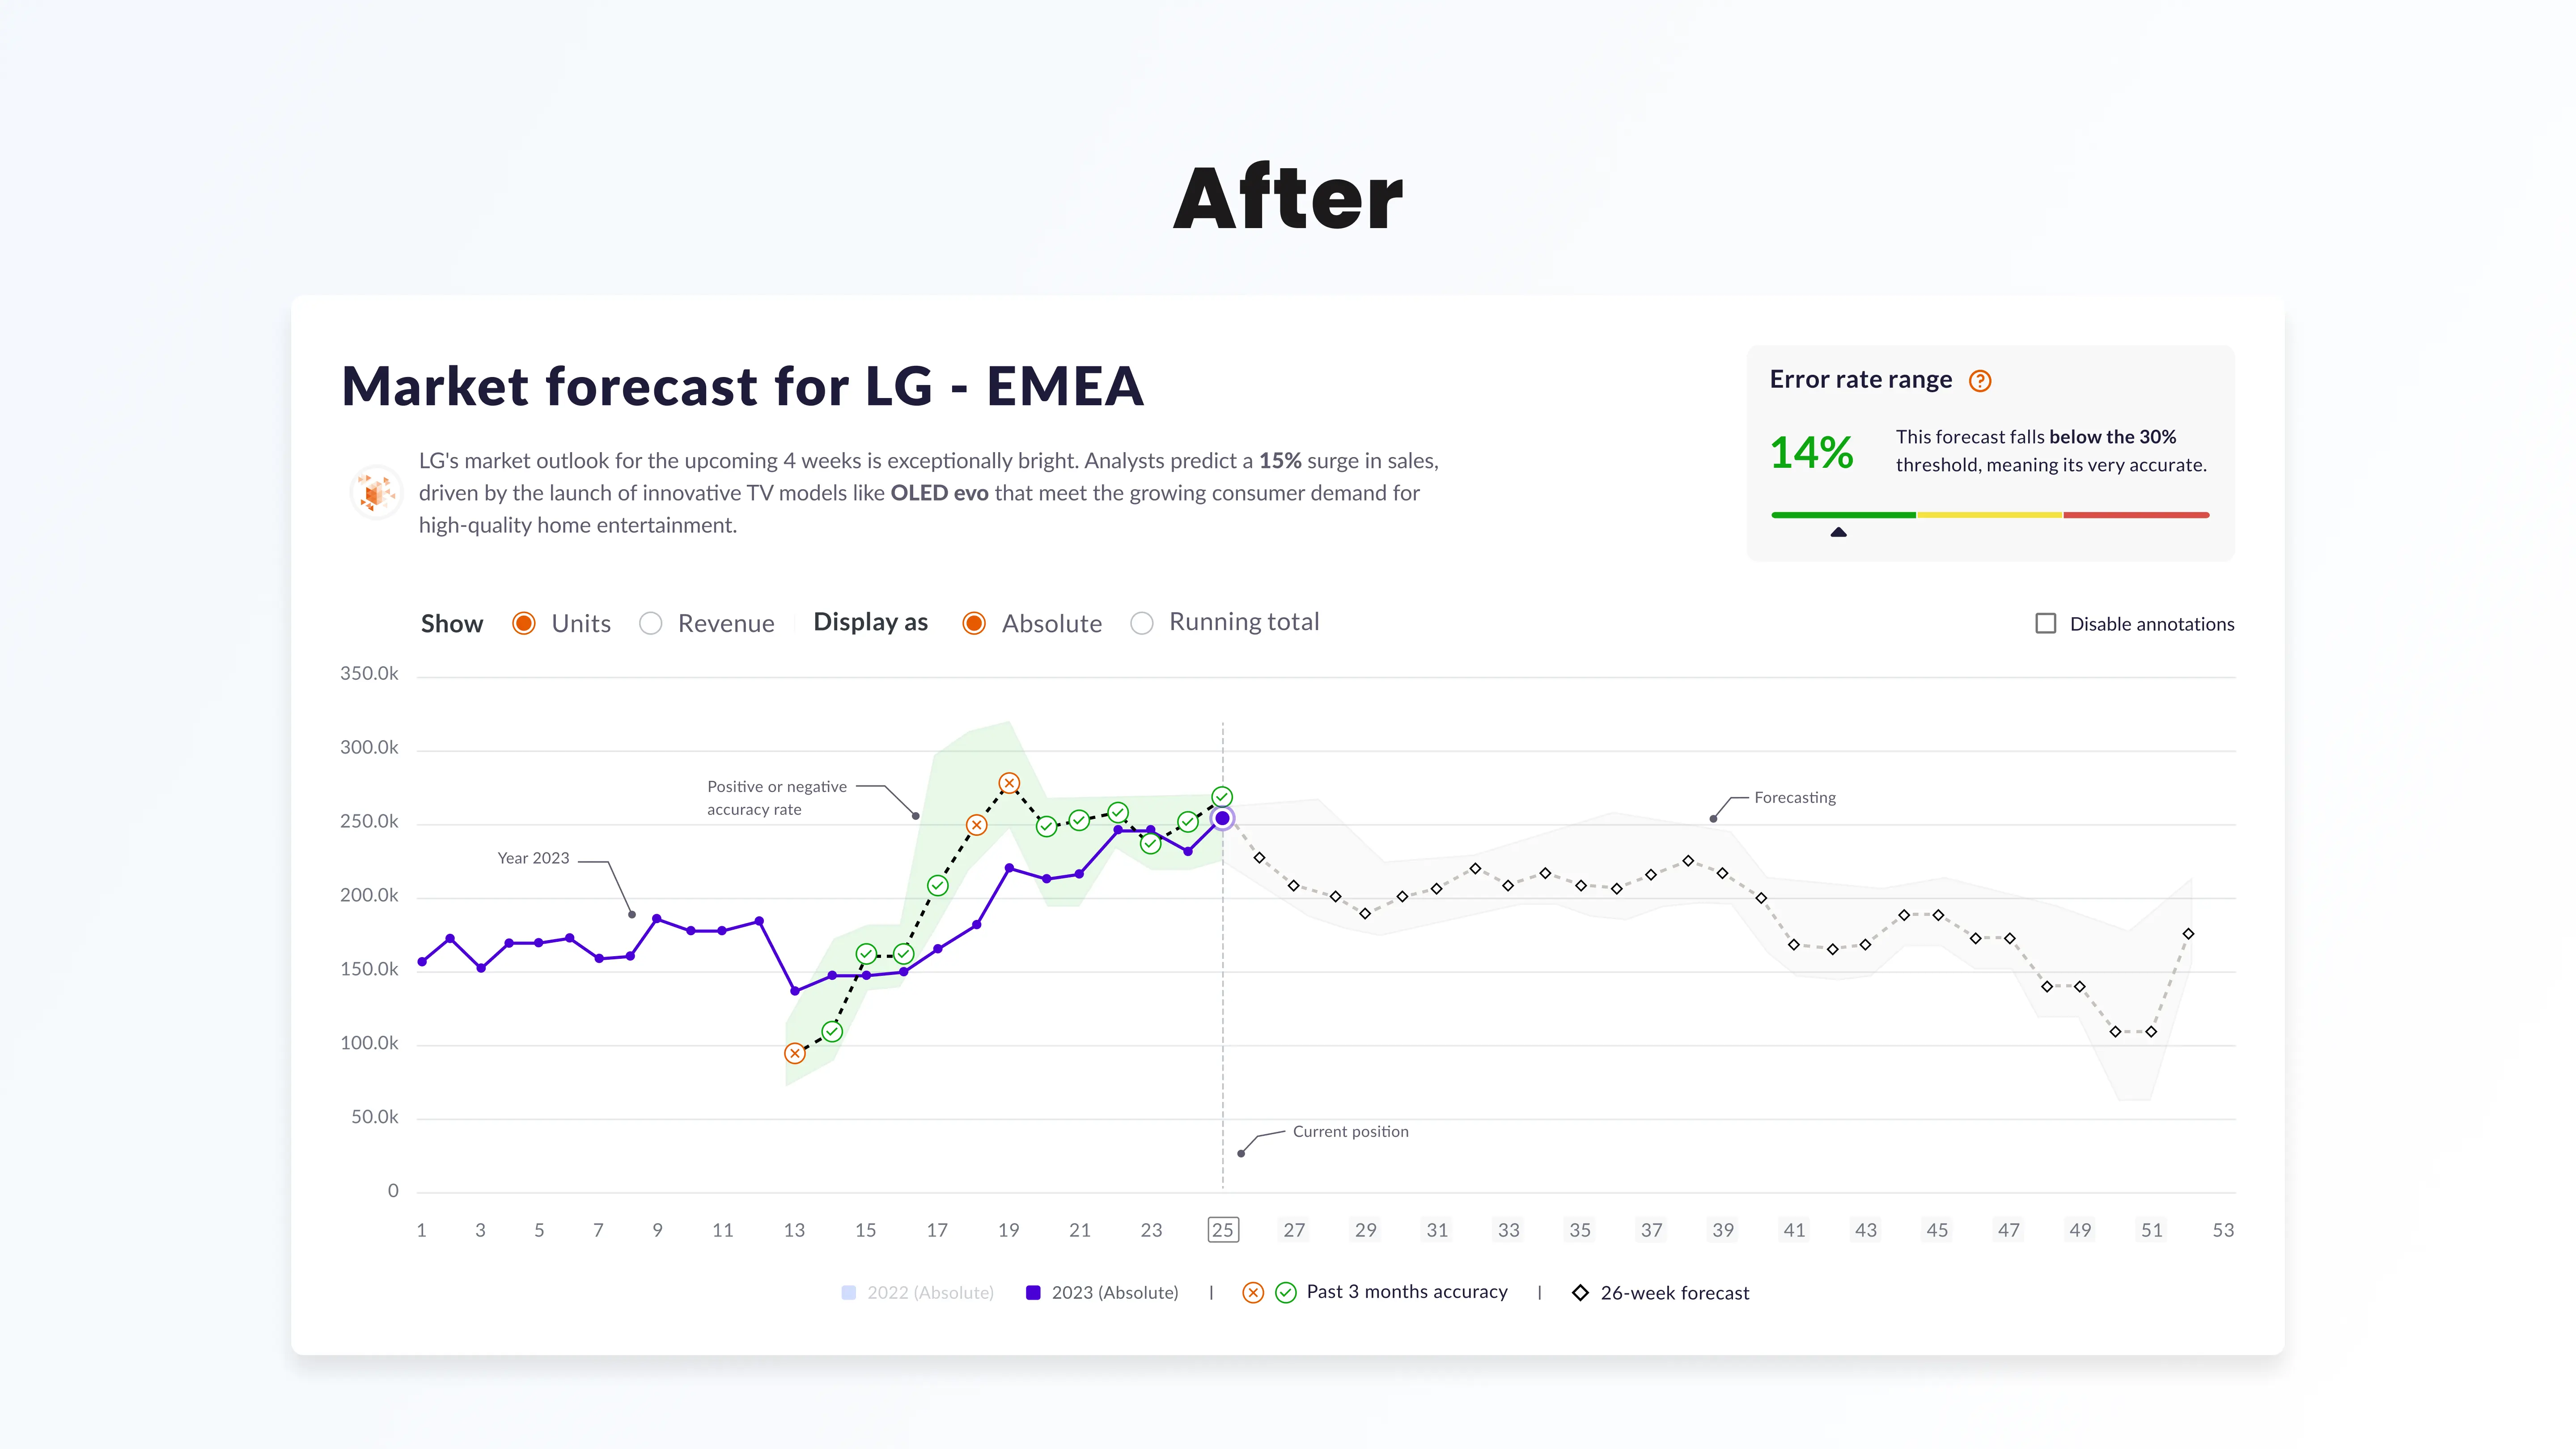
Final platform UI
The project is always evolving, and we use tools like Amplitude and Hotjar to gather user feedback and uncover new challenges.
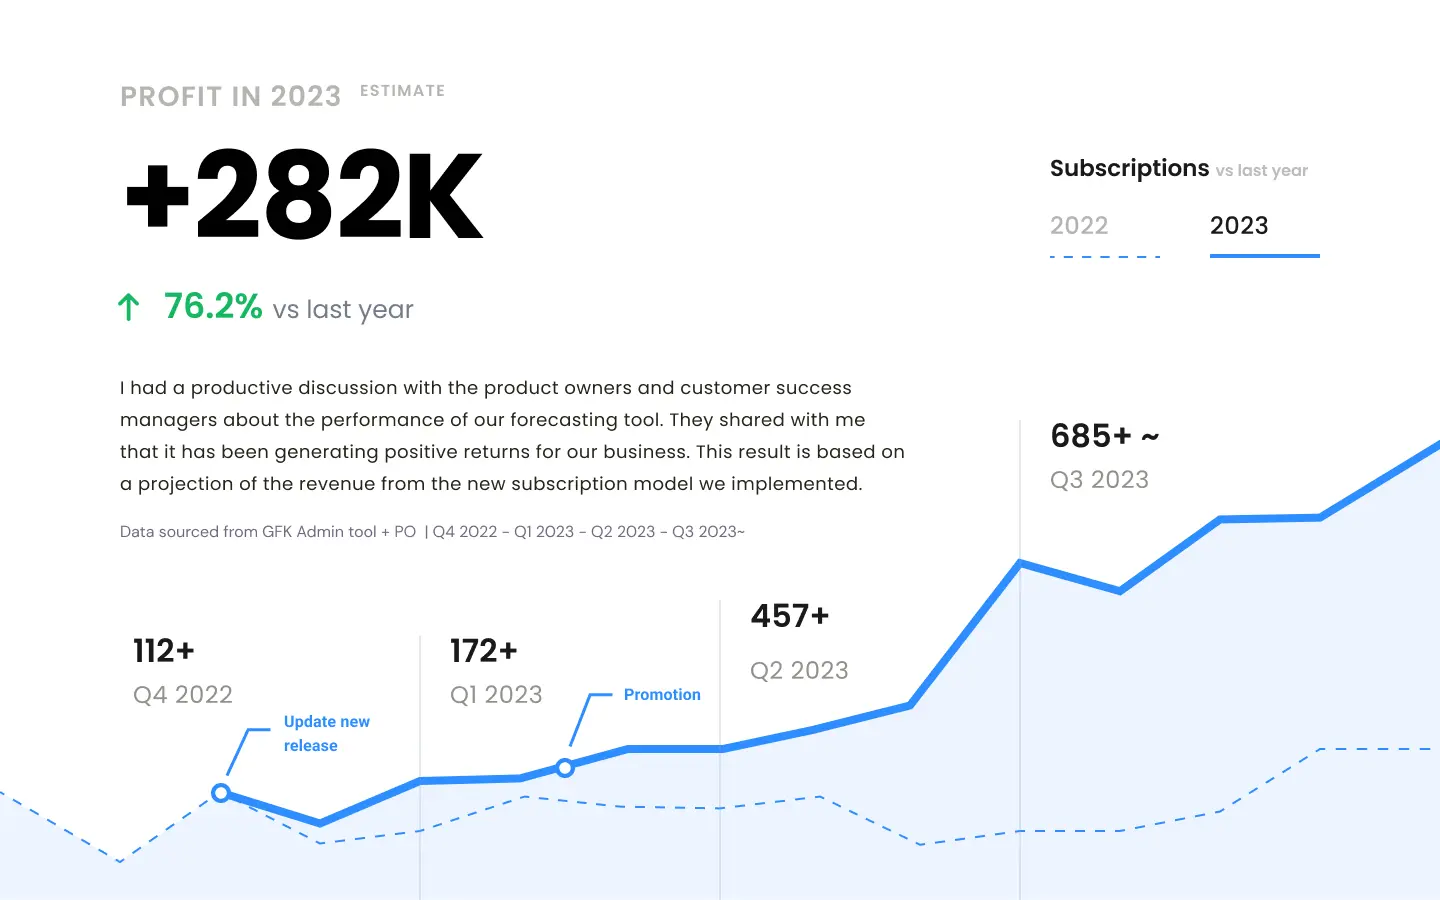
The methodology i followed for this project approach has fostered increased productivity internally and a successful/ positive user experience, as evidenced by the report below. Subscription rates and customer satisfaction surveys (CSAT) are the key metrics we're monitoring.
Stats of achievements